Slide 4 of 6 from Harvey Ball Shapes for PowerPoint
Harvey Balls Table Design for PowerPoint
Harvey Balls Table for Product Comparison
- Table
- Comparison Table
- Comparison Slide
- 16:9
- 100% Editable
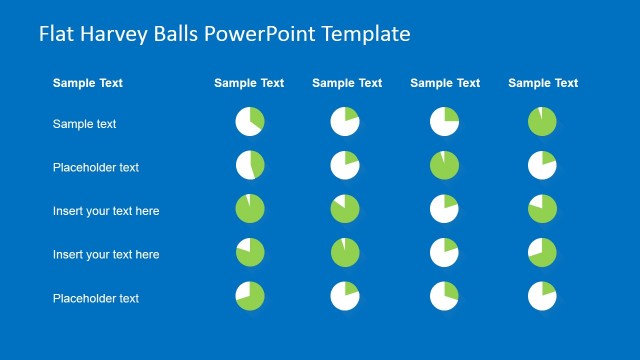
The Harvey Balls Table slide from the Harvey Ball Shapes for PowerPoint template offers a clear and structured format for product comparison and market analysis. This slide layout uses editable shapes to visually represent qualitative data through Harvey balls, making it suitable for business presentations and corporate slide decks that require concise status reporting and competitive insights.
What’s on This Slide
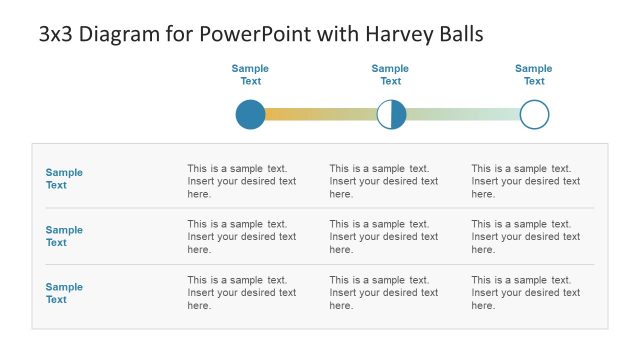
The layout features a structured table with five columns and multiple rows. The top row contains headers labeled 'Products', 'Market Share', 'Popularity', 'Marketing Mix', and 'Market Position', centered within rectangular shapes. Below, each row lists products with corresponding Harvey balls representing data visually. The Harvey balls vary in color and fill, indicating different levels of metrics. Text placeholders are present for product names and descriptions, aligned left within their respective cells. The overall background is light, enhancing readability and focus on the table.
How to Use It
This layout serves as a product comparison table, effectively displaying qualitative ratings across various metrics. It fits within a presentation sequence that discusses product performance or market analysis. This structure is useful for business analysts and product managers to present competitive insights, market share evaluations, and popularity assessments. It can be utilized in meetings, reports, or strategy sessions to visually communicate product standings and facilitate decision-making.
Text Placeholders & Capacity
Keep your copy within these limits so it fits without resizing. Body slots can hold roughly 5-6 words each.
| Placeholder | Count | Max characters (approx.) |
|---|---|---|
| Column header | 5 | 20 |
| Row label | 5 | 20 |
| Body paragraph | 5 | 30 |
Slide Keywords
Download unlimited PowerPoint templates, charts and graphics for your presentations with our annual plan.
DOWNLOADReturn to Harvey Ball Shapes for PowerPoint.