3D Sliced Spheres for PowerPoint – Generate eye-catching infographics which serve to improve reporting while not overpowering the content. The PowerPoint template contains four creative 3D sliced spheres that can be used to replace progress numbers and texts with professional visuals.
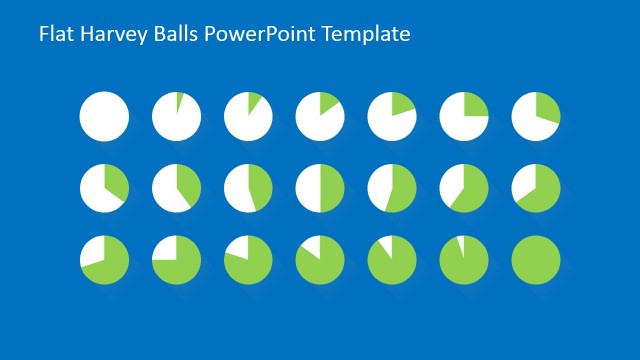
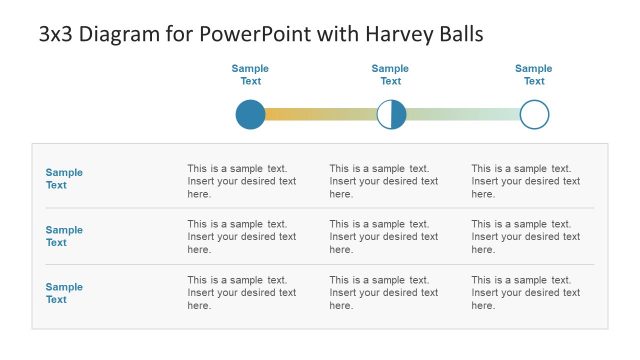
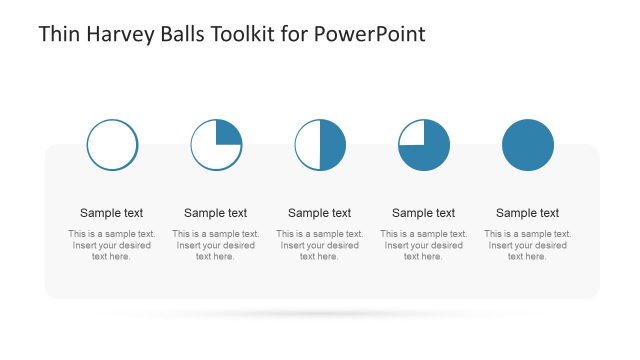
The PowerPoint Template applies the concept of Harvey balls. Harvey Balls, sometimes called Booz Balls, are usually represented by a simple flat circle, which is then shaded proportionally to represent visual quantity. They are used in comparisons to show the degree to which an element meets a specific criterion. It functions similarly to a donut chart to show status and progress.
Harvey Balls can be used in infographics to show KIP’s (key performance indicators). The slide design containing four variations of the Harvey Balls for 25%, 50%, 75% and 100% progress values. The corresponding angles of the Harvey Balls can be used in project management.
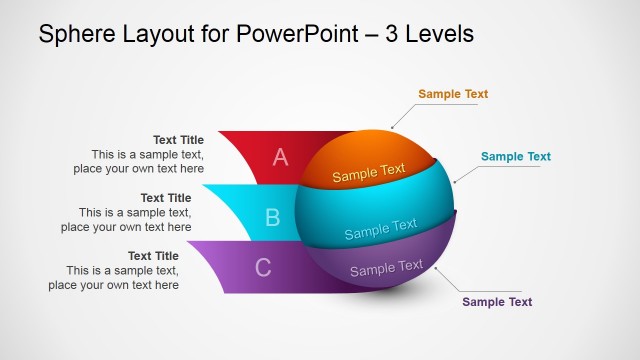
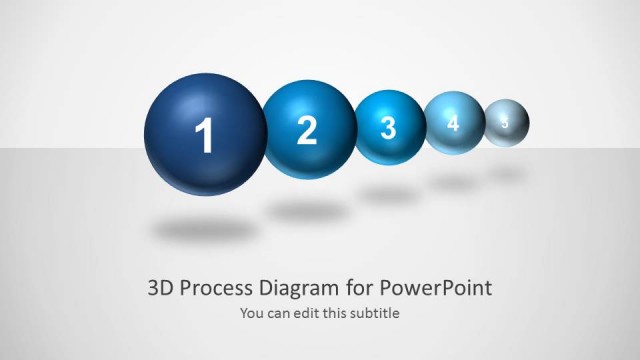
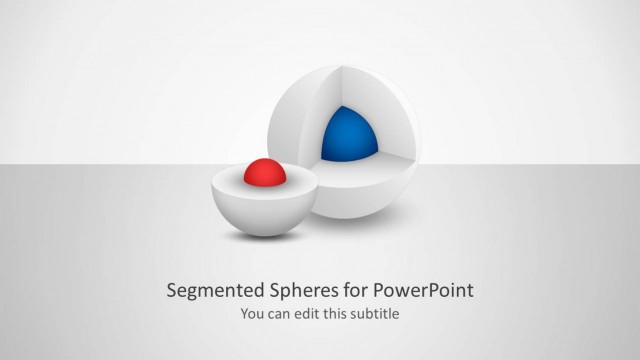
The respective shadings, or in this case, fills, of the ball allow the presenter to relate these 3D spheres to the same concept as the Harvey Balls. These 3D vector equivalents give more impact to the presentation by making the PowerPoint graphics pop out of the simple black-gray presentation background.
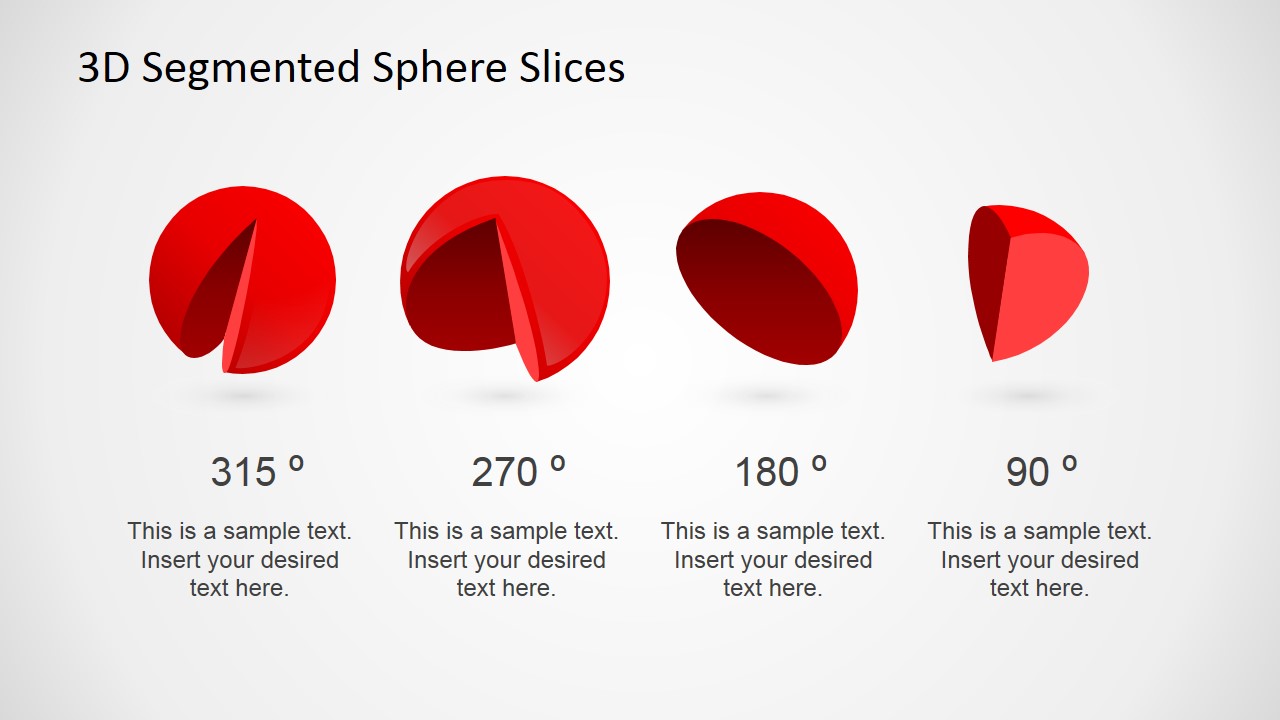
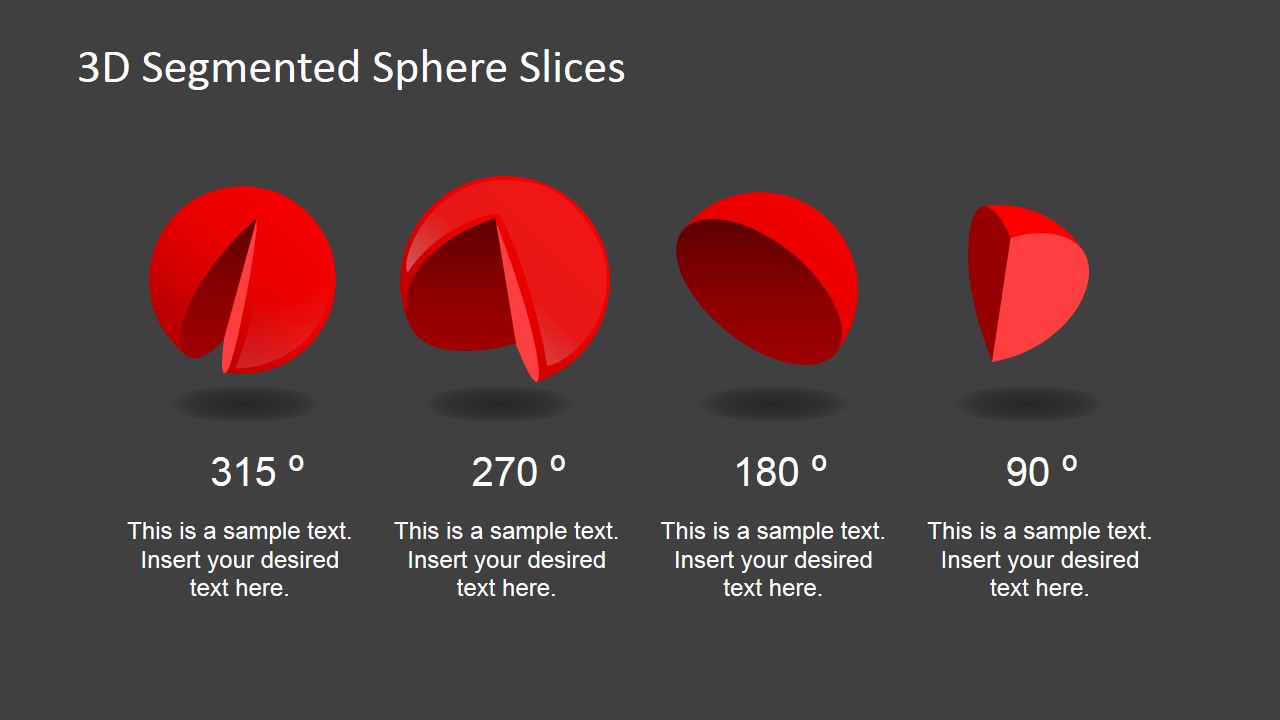
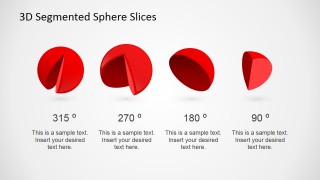
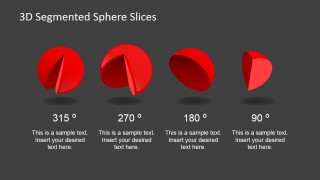
The overview slide of the presentation, the one featuring four spheres, can be used as progress indicators in specific areas of the business plan. Each sphere can correspond to a specific core component or step in the procedure. They can then be adjusted using the 100% editable features to how the proper Harvey Ball form for each.
The 3D Sliced Sphere for PowerPoint is most suitable for project progress meetings, business reviews and project dashboards. The slide allow the presenter to showcase several inputs of data through the PowerPoint, assuring a quick and easy way to explain the different processes. The presenter can also download the Flat Harvey Ball PowerPoint template to extend the report.
What’s inside this template
Example presentation scenarios
- A project manager can show initiative completion in a steering committee update using the four-sphere overview with 315, 270, 180, and 90 degree progress states.
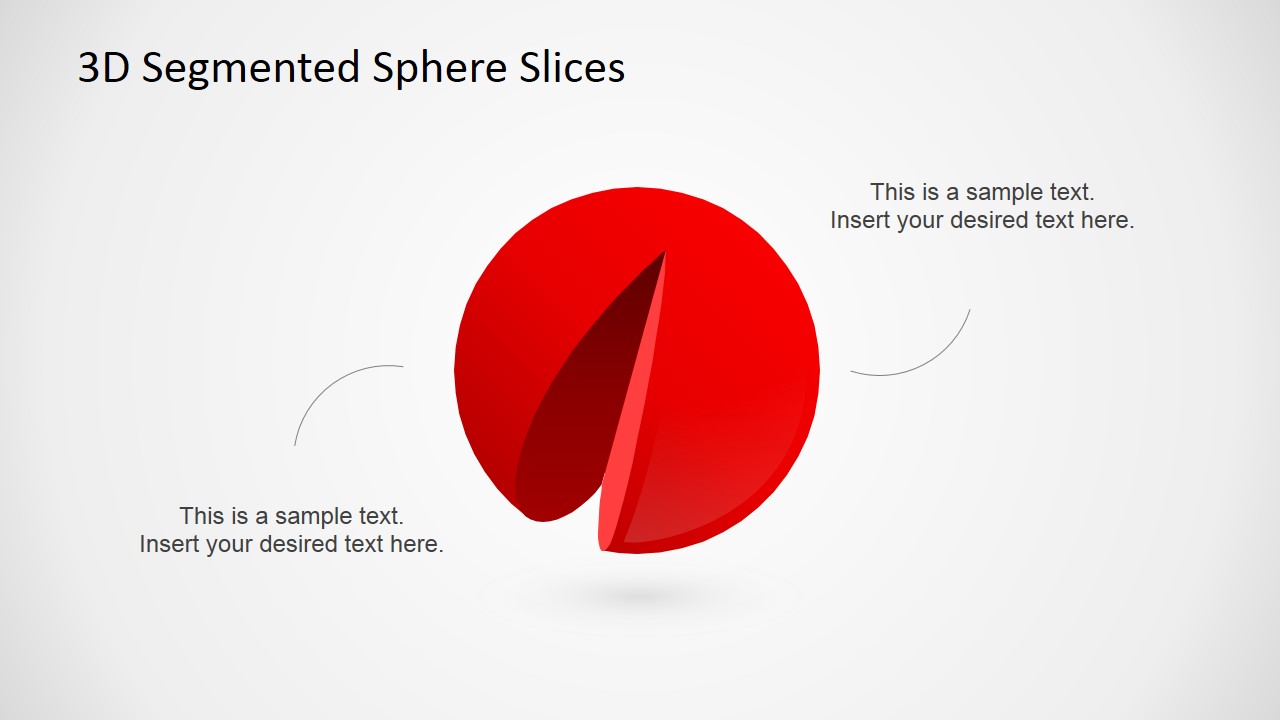
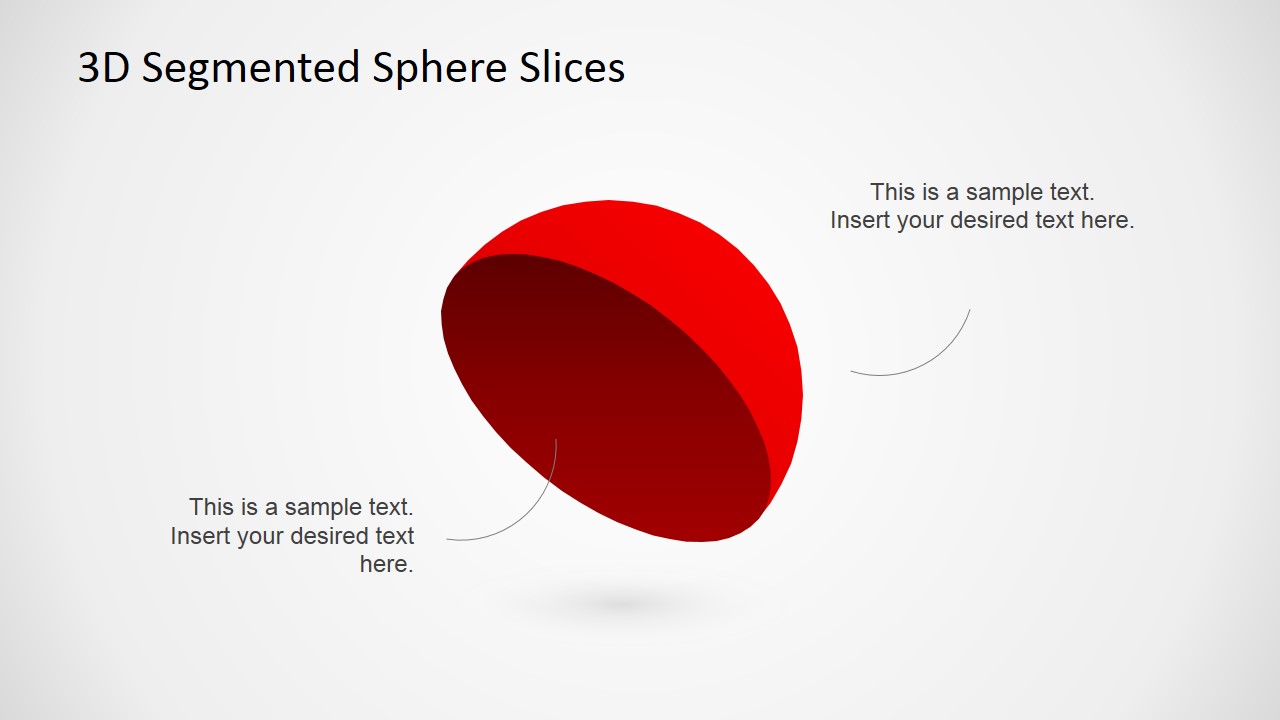
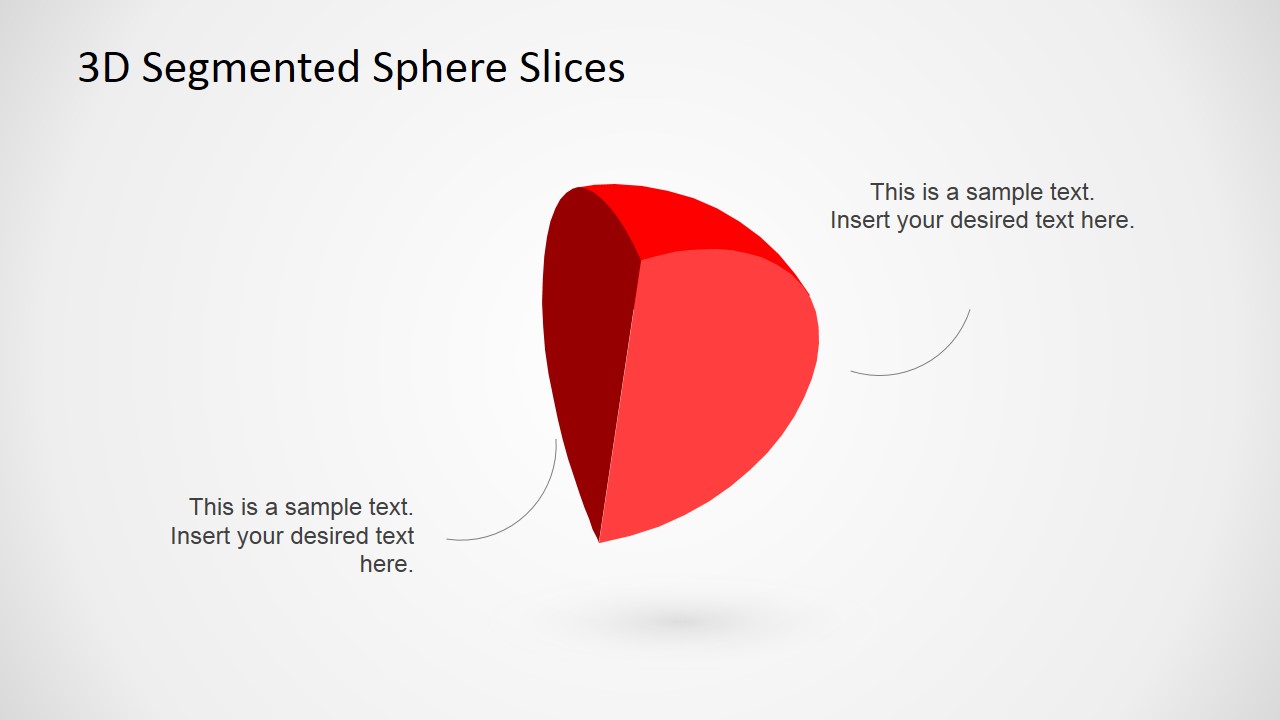
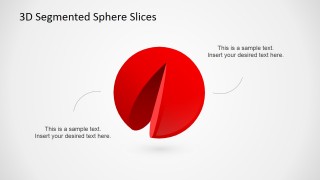
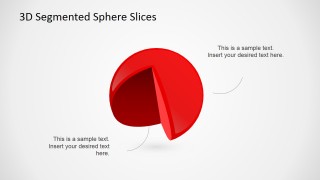
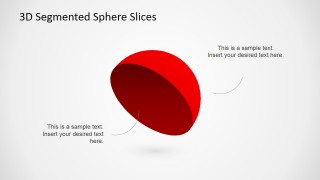
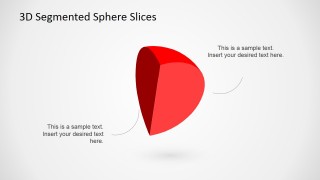
- A business analyst can explain the status of one KPI by using a single large sliced sphere callout with short notes on both sides.
- A consultant can compare maturity levels across workstreams by placing each workstream under one of the 3D Harvey Ball-style sphere indicators.
- An operations leader can use the dark-background comparison slide to summarize priority areas in a concise executive review.
Features
- 100% editable presentation template
- Compatible with Microsoft PowerPoint and Google Slides
- 16:9 aspect ratio slides
- Scalable vector shapes, icons and illustrations
- AI-Ready for Microsoft Copilot and Claude
- Instant access and download
Frequently asked questions
Q: How should a presenter explain progress with these 3D sliced spheres?
A: Treat each sphere as a visual status indicator, not as decoration. Define what the 315, 270, 180, and 90 degree states mean before showing comparisons. Use the four-sphere overview for the summary, then move to a single large sphere callout when one status needs supporting notes, risks, or next actions.
Q: For which business situations is this template the best fit?
A: This template fits short status presentations where the audience needs to compare a few levels quickly. Project reviews, KPI snapshots, portfolio updates, and consulting readouts can use the sliced spheres to show relative progress without dense charts. It is strongest when the message is degree of completion or readiness.
Q: Why use a sliced sphere metaphor instead of a flat Harvey Ball?
A: The 3D sphere makes partial completion more visible because the missing or separated segment creates depth and contrast. That visual metaphor helps an audience notice status levels before reading the captions. The repeated sphere shape also keeps the comparison consistent across the overview, single callouts, and dark-background version.

3D Sliced Spheres for PowerPoint
6-slide presentation template with 3D sphere slices and Harvey Ball progress visuals
3D Sliced Spheres for PowerPoint is a 6-slide shapes template for status reporting and visual progress comparisons. It includes a four-sphere overview, single large sphere callouts, Harvey Ball-style angle indicators, and a dark-background comparison slide. The template is built for project managers, analysts, and business presenters in Microsoft PowerPoint and Google Slides.
- Category
- Shapes
- Rating


 Loading...
- Aspect ratio
- 16:9, 4:3
- Item ID
- 6653-01
- Colors
 Microsoft PowerPoint
  Microsoft Copilot
  Claude for PowerPoint
 Other formats supported
Subscribe today and get immediate
access to download our PowerPoint templates.