Thin Harvey Balls Toolkit PowerPoint Template
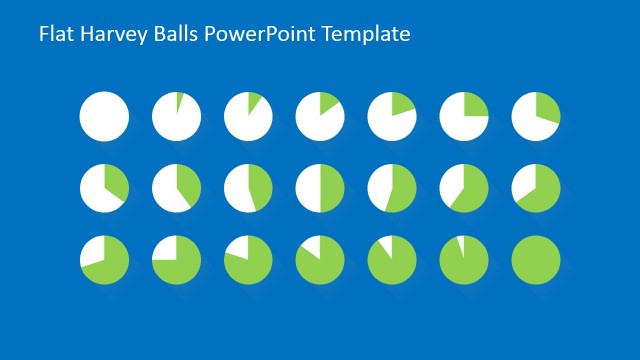
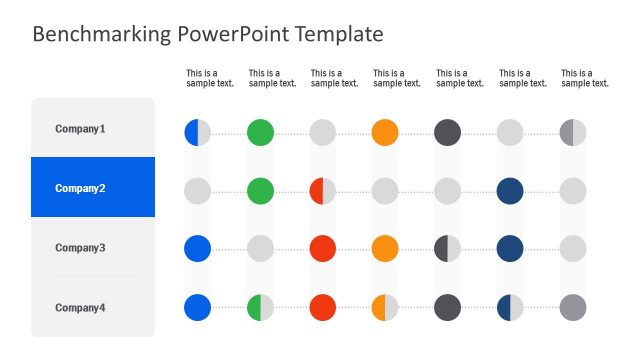
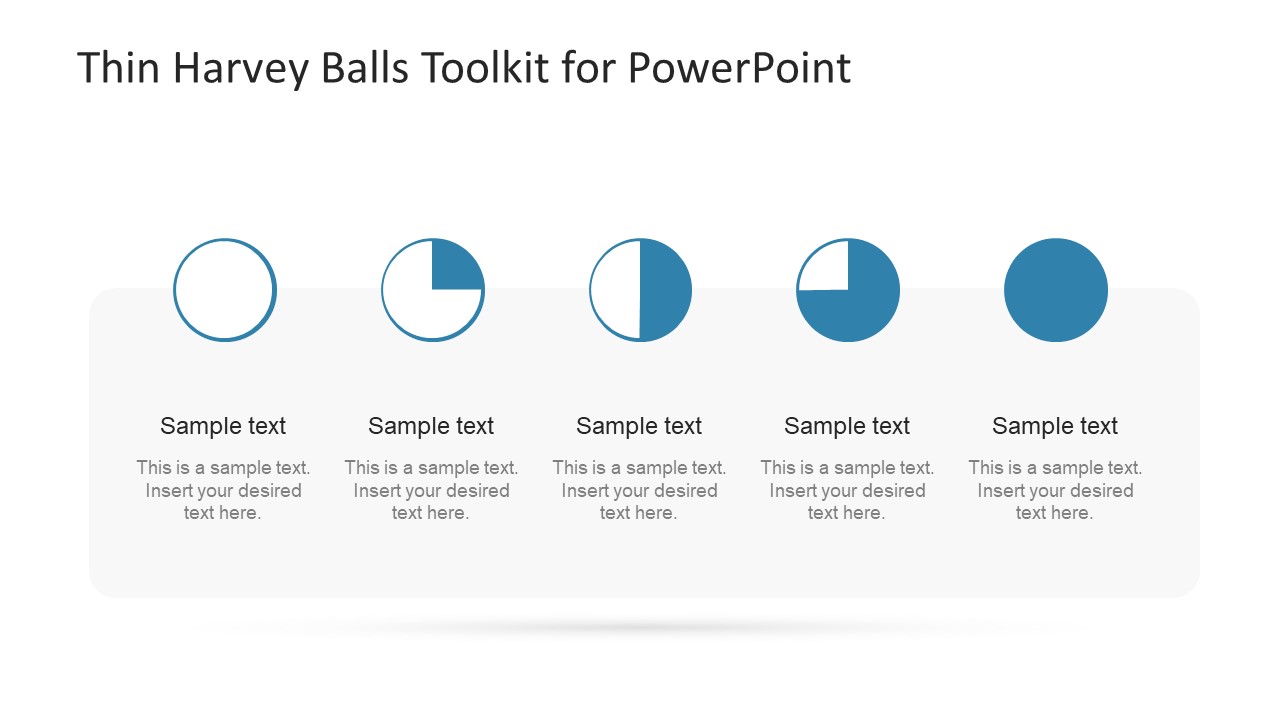
The Thin Harvey Balls Toolkit PowerPoint Template is a graphical presentation of qualitative data. The Harvey Balls are used in comparison analysis of an item to identify the level of criteria it meets. For example, the quality characteristics of a product, like sensitivity, material, security, or taste. These elements are difficult to summarize as numerical values; hence, use Harvey Balls. Also, you can use the circular icons to track the completion of tasks. Such as the percentage of activity in the Gantt chart to graphically illustrate the completion of the process. This PowerPoint contains the visualization tools slides to display the business maturity levels. These Harvey balls icons have different meanings for each business concept presentation. Also, the company can create its own terms to identify icons’ meanings.
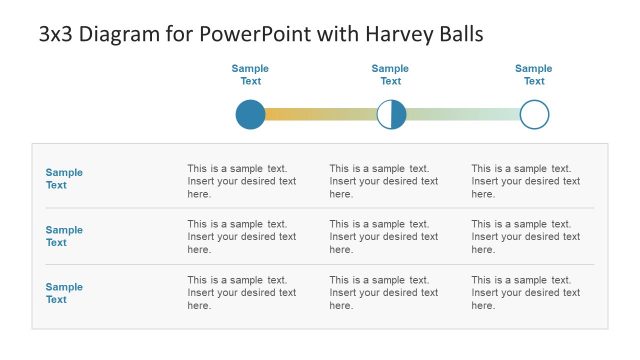
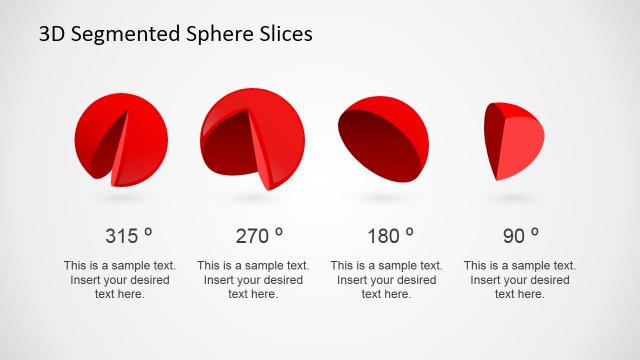
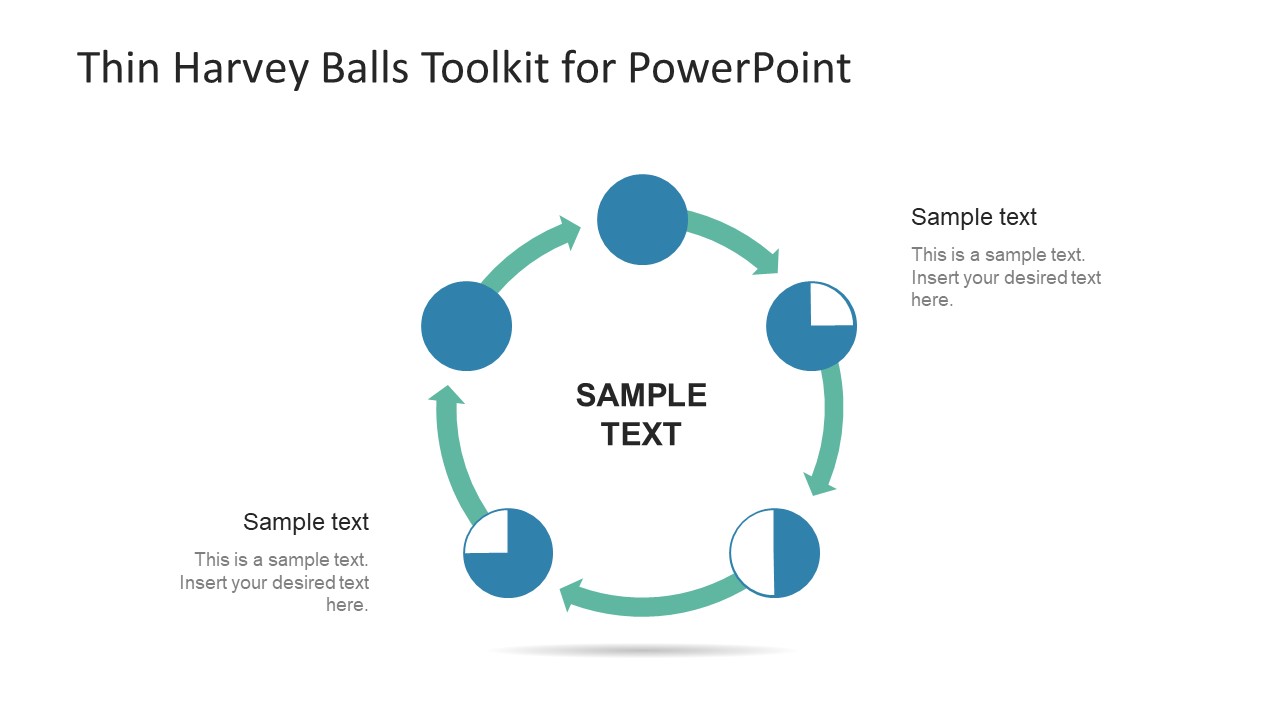
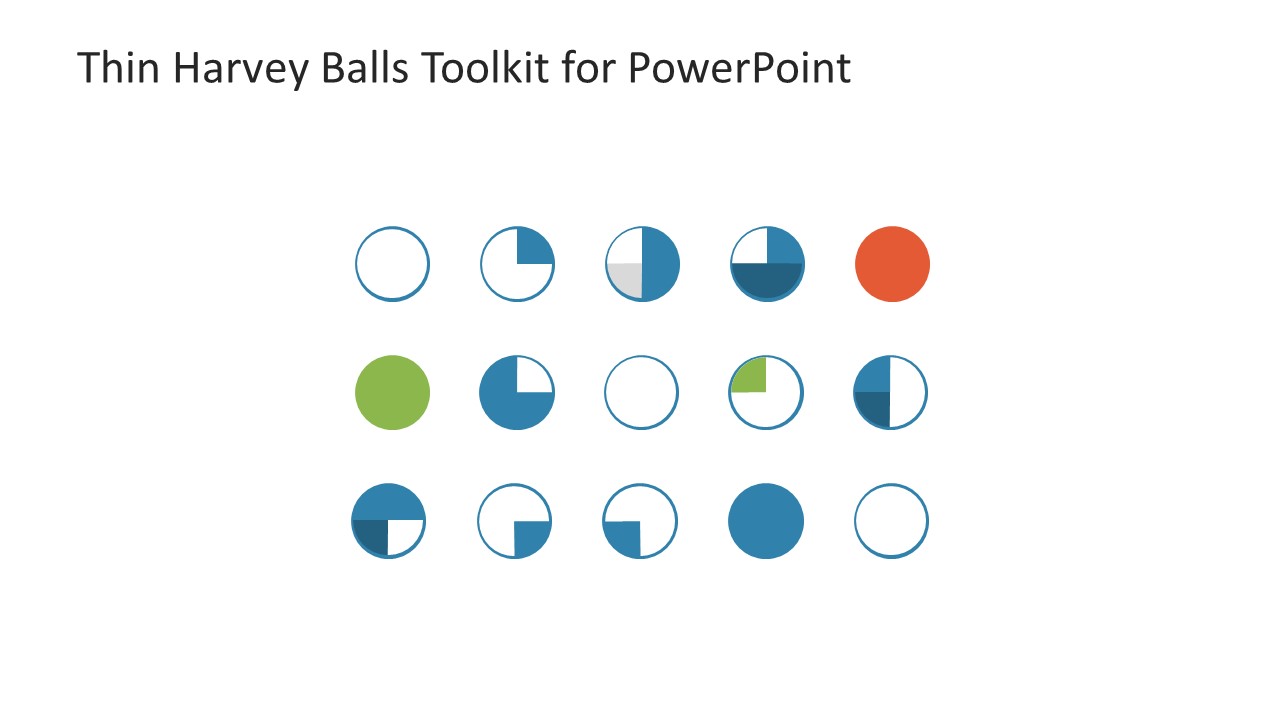
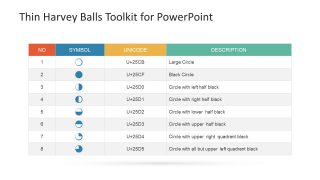
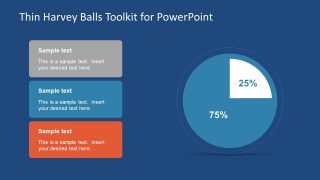
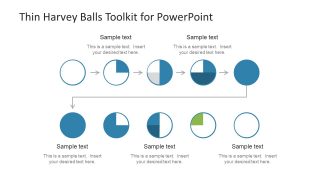
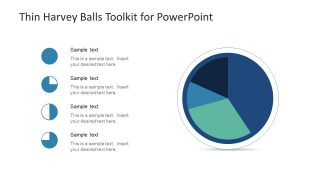
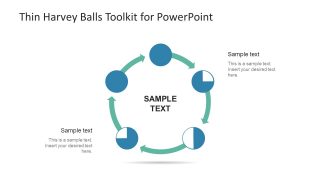
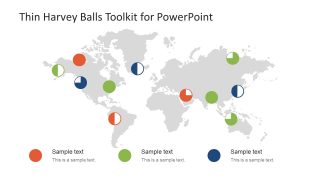
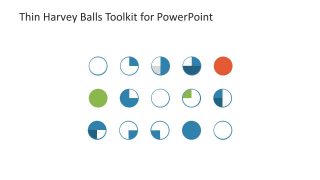
The Thin Harvey Balls PowerPoint Template has eight slides of variant designs—the clockwise presentation of icons presenting data like a pie chart. The table can help explain the meaning of certain Harvey Balls using the Unicode and description column. Further, the flat vector design helps determine the percentage of each characteristic individually. Also, there is a step-wise template design to show the progress of an element—another pie chart diagram of multiple colors to display data in one circle. Similarly, the cyclic model can assist in presenting the lifecycle of a process or product with a graphical image. Moreover, the slide of the world map background shows the statistical data uses of Harvey balls.
Thin Harvey Balls Toolkit PowerPoint Template is an editable presentation of a thin toolkit enabling users to alter various design aspects. For instance, change the colors or size of Harvey balls using the shape fill option in the format drawing. Additionally, insert helpful information is available text placeholders to explain the qualitative data. The Harvey Balls are widely used in graphical shapes, which can uniquely impress the audience. Alternatively, you can download other Harvey Ball templates for Google Slides & PowerPoint presentations.


You must be logged in to download this file.
DOWNLOAD- Category
- Data & Charts
- Rating

 Loading...
- Size
- 16x9
- Item ID
- 7581-01
- Colors
Subscribe today and get immediate
access to download our PowerPoint templates.