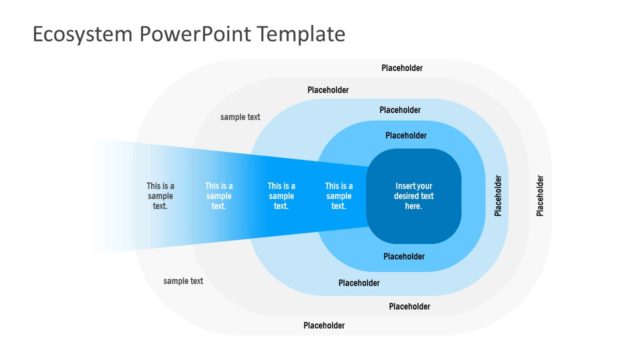
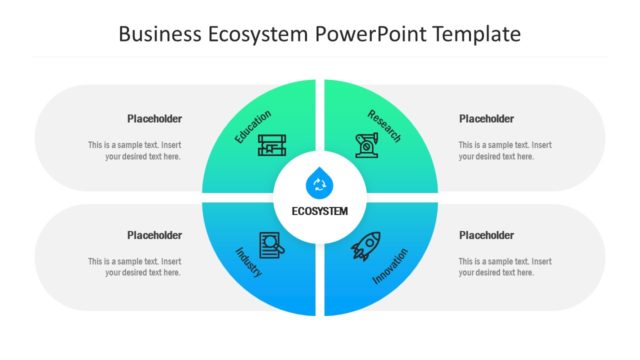
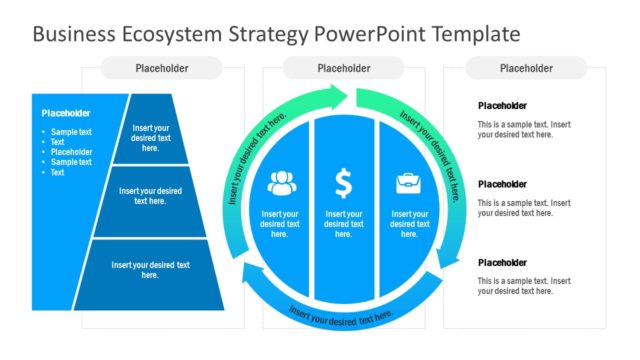
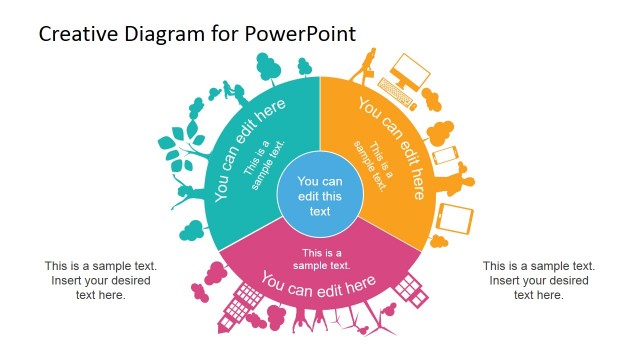
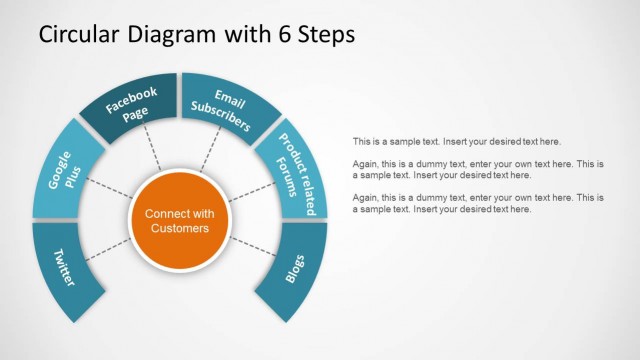
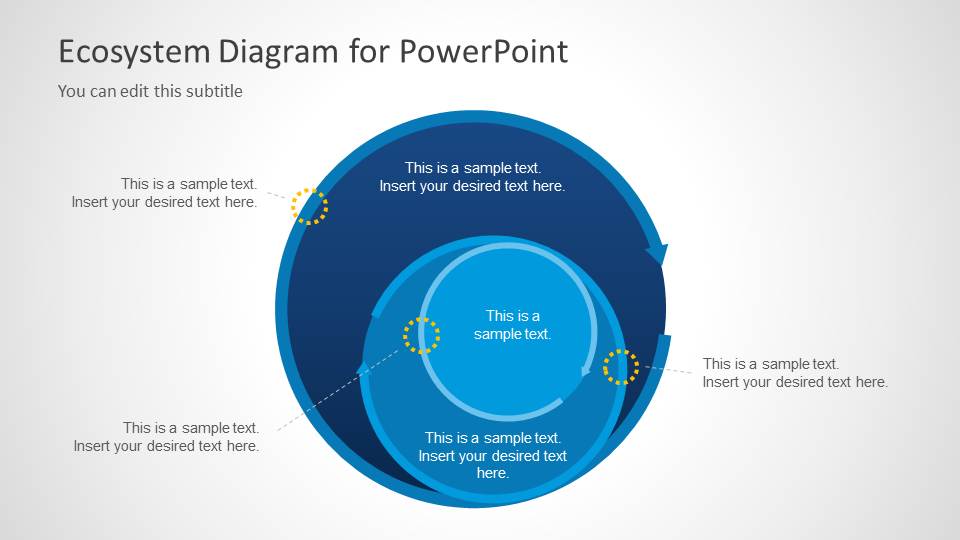
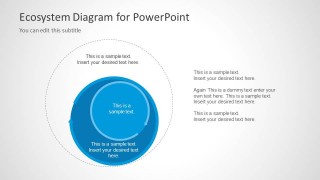
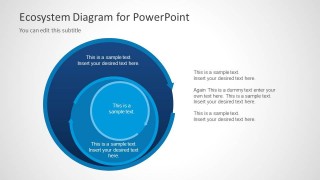
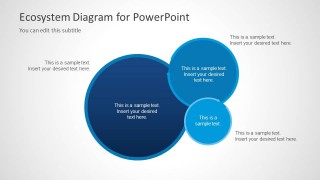
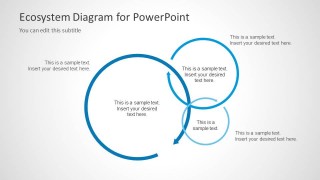
Ecosystem Diagram for PowerPoint is a nice presentation design containing 6 unique slide designs with a circular diagram that you can use to represent an ecosystem, a cmmunity of living things and their non-living environment. You can also use this diagram as an alternative to Venn Diagrams in PowerPoint.
What’s inside this template
Example presentation scenarios
- A strategy consultant can use the concentric circle layouts to explain how partners, customers, and external forces surround a central business or initiative.
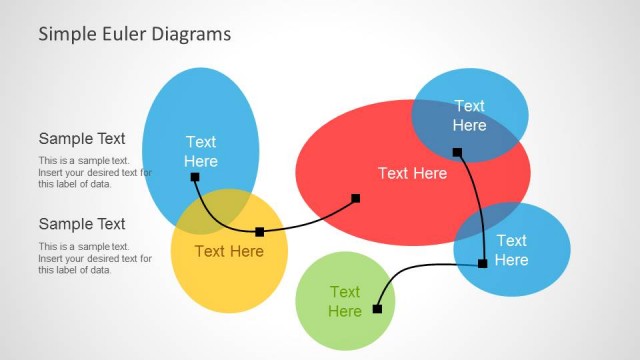
- A product manager can use the overlapping circle diagrams to show how platform components, user groups, and third-party services interact in one ecosystem.
- An educator can use the dotted boundary ring slides to introduce ecological or community systems and distinguish the core element from its surrounding environment.
- A nonprofit program lead can use the callout marker slide to map local stakeholders, service points, and relationships around a community program.
Features
- 100% editable presentation template
- Compatible with Microsoft PowerPoint and Google Slides
- Scalable vector shapes, icons and illustrations
- AI-Ready for Microsoft Copilot and Claude
- Instant access and download
Frequently asked questions
Q: How should I organize the message when presenting an ecosystem diagram?
A: Start by naming the central entity, then explain the surrounding rings before moving to callouts or overlaps. The concentric circle slides work best when the audience first understands what sits at the center and why the outer layers matter. Use the text callouts for implications, dependencies, or stakeholder roles rather than long descriptions.
Q: Who is this template best suited for?
A: This template fits presenters who need to explain a system of relationships rather than a linear process. Strategy teams, product managers, consultants, educators, and program leaders can use it to map a market, platform, community, or environment. The visible layouts support early analysis, stakeholder alignment, and concept explanation.
Q: Why use circular diagrams instead of a list or standard table?
A: The circle metaphor helps show interdependence, boundaries, and shared context in a way a list cannot. Concentric circles communicate core-to-periphery relationships, while overlapping circles suggest interaction between groups or components. This visual structure lets the audience see the ecosystem as one connected model before focusing on individual details.


Ecosystem Diagram for PowerPoint
6-slide PowerPoint presentation template with circular ecosystem diagrams, concentric rings, and stakeholder callouts
Ecosystem Diagram for PowerPoint is a 6-slide diagram template for showing systems, communities, stakeholder networks, or business environments. The deck includes layered concentric circles, dotted boundary rings, callout markers, and overlapping circle diagrams. It is built for presenters who need a PowerPoint visual for relationships, dependencies, and ecosystem structure.


 Loading...
 Microsoft PowerPoint
  Microsoft Copilot
  Claude for PowerPoint
 Other formats supported
Subscribe today and get immediate
access to download our PowerPoint templates.