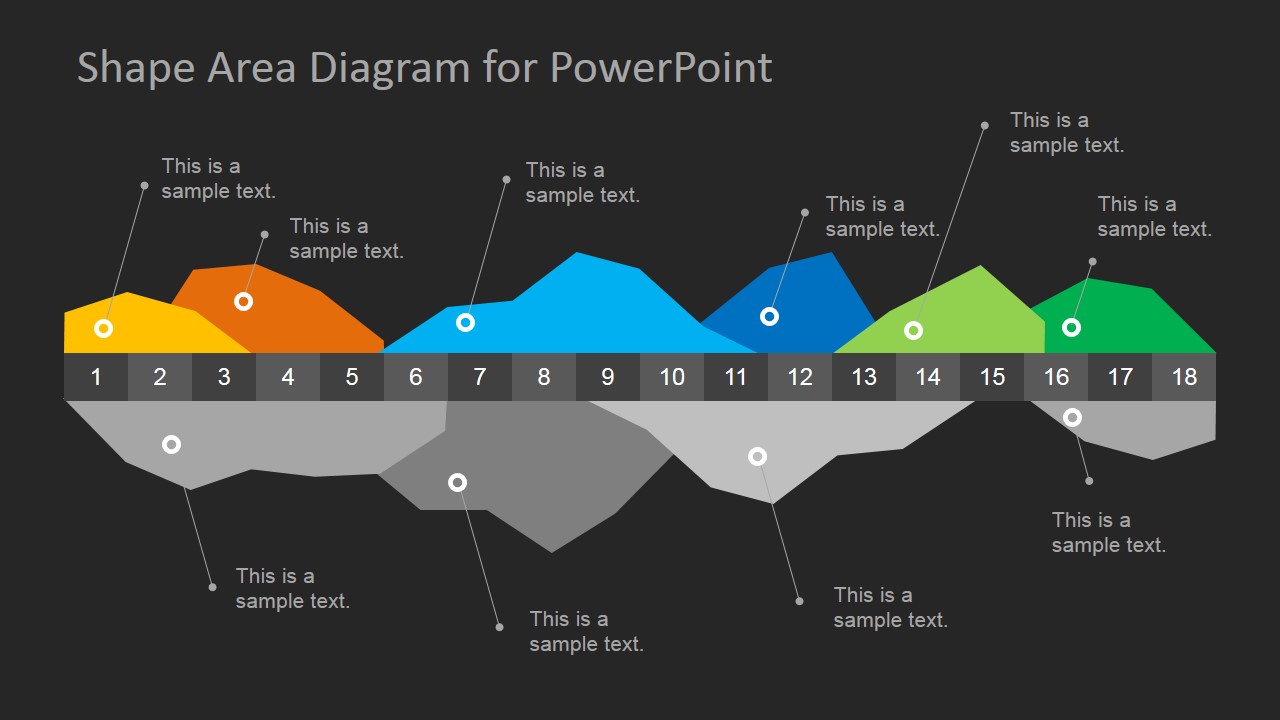
Dark Area Chart Template for PowerPoint is a variant of the infographics Area Chart Template for Microsoft PowerPoint. You can use this dark area data chart to prepare infographics using PowerPoint with a dark background color.
This chart is not a data-driven template which means that you cannot edit the chart by entering your data in an Excel spreadsheet, but you can edit the area chart by changing the PowerPoint shapes via Edit Points. If you need accurate area data chart then we’d recommend you to browse our beautiful data-driven PowerPoint chart templates or PowerPoint graphs.
What’s inside this template
Example presentation scenarios
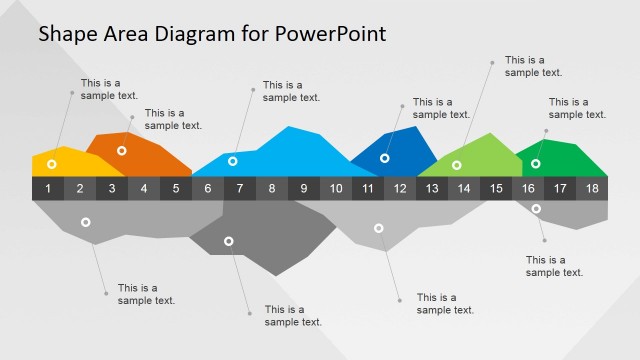
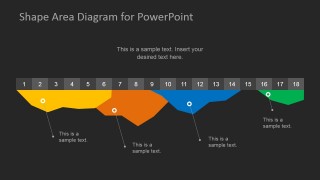
- A business analyst can use the positive-negative area diagram to explain how performance rises and falls across numbered stages in an executive update.
- A product manager can use the 18-step callout layout to map feature adoption, user behavior, or release phases without building a full spreadsheet chart.
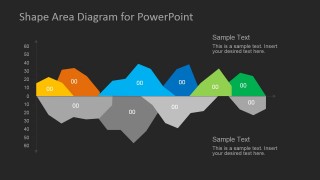
- A consultant can use the inverted area comparison to show downside pressure, risk exposure, or cost movement across a timeline for a client workshop.
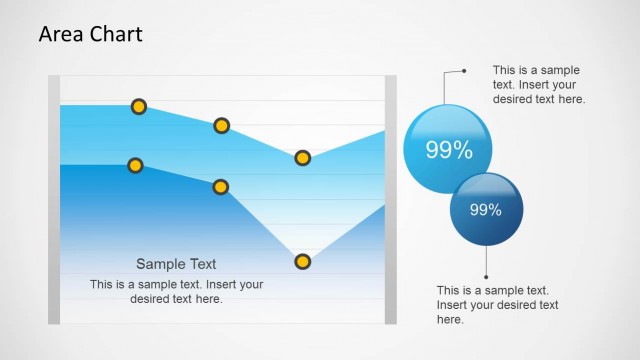
- A project lead can use the y-axis area chart slide to summarize milestone-level indicators and add short interpretation notes beside the visual.
Features
- 100% editable presentation template
- Compatible with Microsoft PowerPoint and Google Slides
- 16:9 aspect ratio slides
- Scalable vector shapes, icons and illustrations
- AI-Ready for Microsoft Copilot and Claude
- Instant access and download
Frequently asked questions
Q: How should the presenter explain this shape-based area chart without overstating precision?
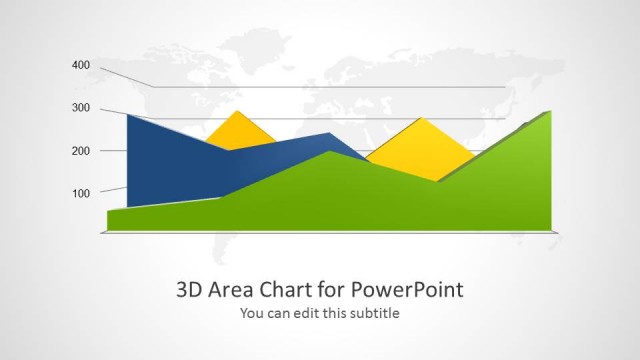
A: Position the area shapes as an infographic view of direction, intensity, and sequence rather than a statistically exact chart. Use the numbered baseline and callout labels to explain what happens at key stages. If precise values matter, reserve slide 4 for approximate scale context and state the measurement method verbally.
Q: Who is this template best suited for in a business presentation?
A: It fits analysts, consultants, product managers, and project leads who need to explain patterns across time, phases, or categories in a compact visual section. The 18-step band works well for staged processes, while the positive-negative layouts help audiences compare gains, drops, risks, or outcomes at a glance.
Q: Why use peaks, dips, and a dark background for this message?
A: The area shapes create a visual metaphor for movement: peaks show momentum and dips show pressure or loss. The dark background pushes attention to the colored segments, while the gray negative areas separate downside information. This makes the slide easier to scan than a dense table of stage notes.


Dark Infographics Area Chart Template for PowerPoint
4-slide presentation template with dark area chart infographics, callouts, and positive-negative trend diagrams
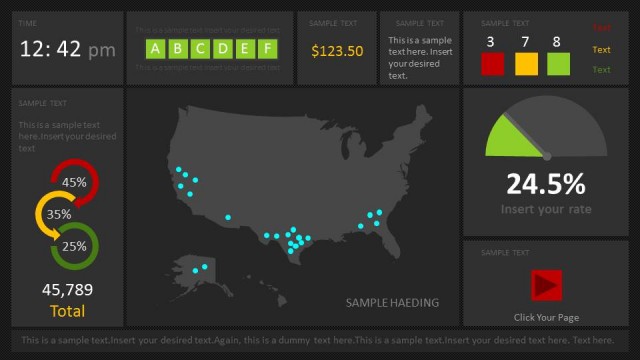
This is a 4-slide, 16:9 presentation template for Microsoft PowerPoint and Google Slides featuring dark-background, shape-based area chart infographics. Visible layouts include an 18-step positive-negative area diagram, a positive area strip with callouts, an inverted area comparison, and a y-axis area chart for analysts, product teams, and business presenters.
- Category
- Data & Charts
- Rating


 Loading...
- Aspect ratio
- 16:9
- Item ID
- 6677-02
- Colors
 Microsoft PowerPoint
  Microsoft Copilot
  Claude for PowerPoint
 Other formats supported
Subscribe today and get immediate
access to download our PowerPoint templates.