Inverted Area Chart Design for PowerPoint
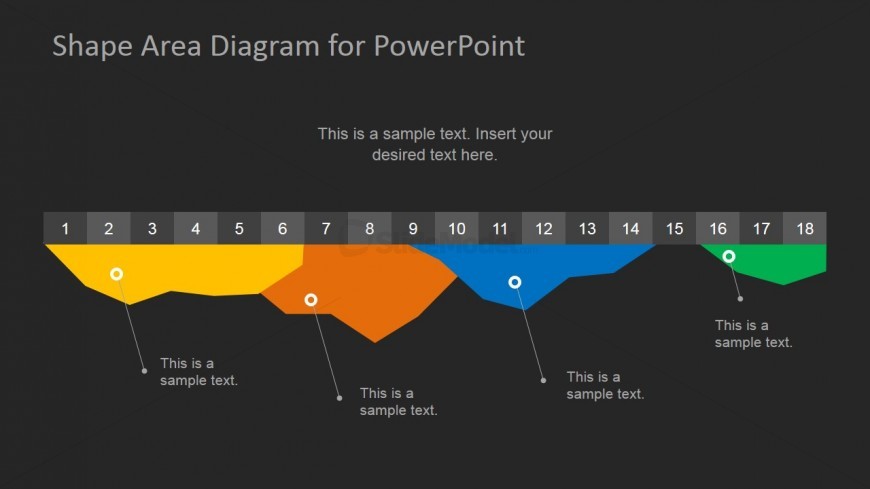
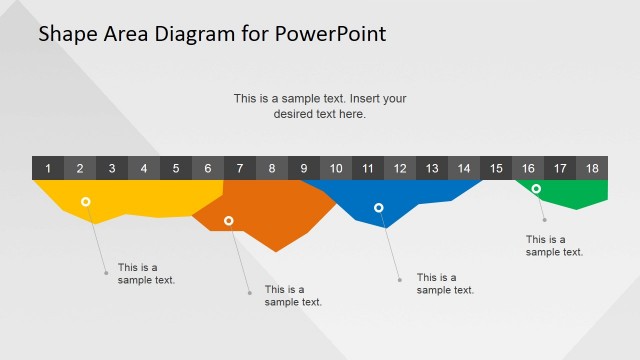
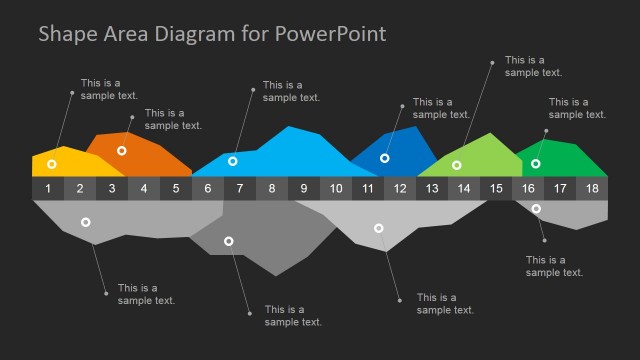
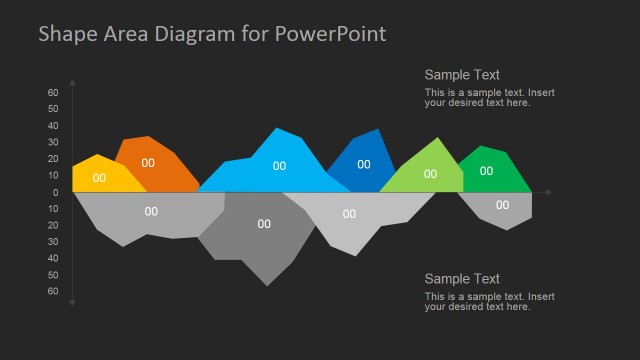
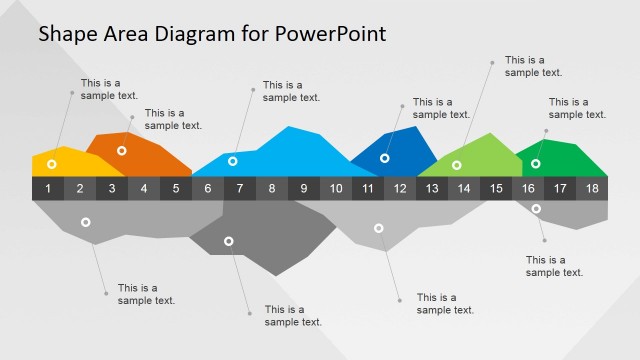
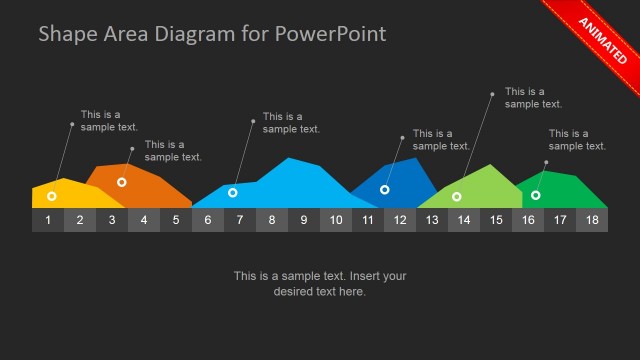
Shown on the Office template is an inverted area chart design for PowerPoint, which may be used to show important statistical data, such as sales, production volumes, and client orders. The PowerPoint graphics found on the PowerPoint slide contain area charts which may be used to show the data across several time periods.
The main feature of the PowerPoint template is a long, rectangular strip, which is divided into eighteen segments colored alternately in dark gray and light gray. These segments are numbered accordingly from one to eighteen, in white font. On the rectangular PowerPoint shape are inverted area charts, colored yellow, orange, blue, and green. A line connects each of these charts to a text placeholder where descriptions and labels may be inserted. A summary or title for the presentation design may be inserted in the text placeholder found near the top of the slide design. All PowerPoint objects are 100% editable to suit the presenter’s needs and preferences.
Return to Dark Infographics Area Chart Template for PowerPoint.