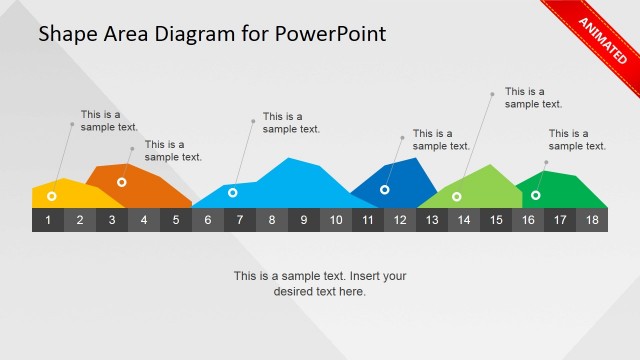
Animated Colorful Area Chart PowerPoint Slide
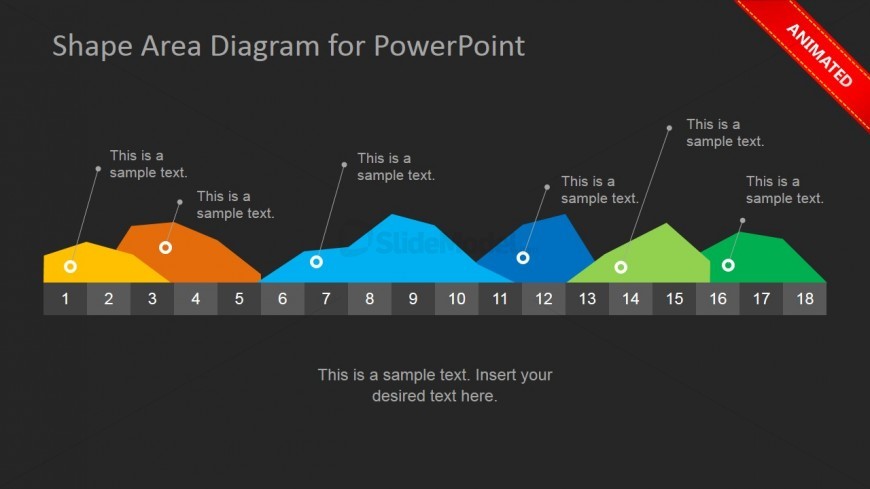
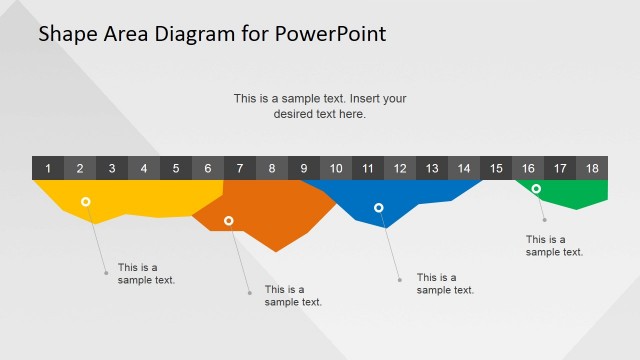
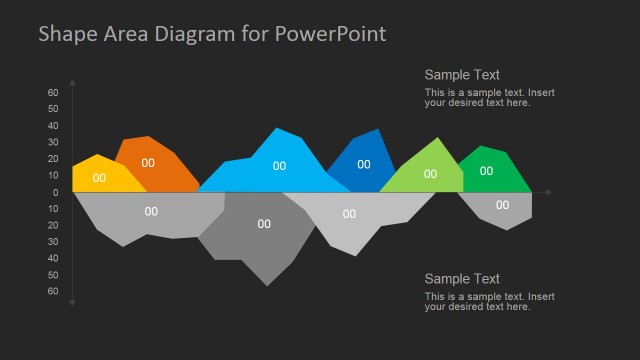
Featured on the Office template is an animated colorful area chart PowerPoint slide, which may be used to show multiple area charts that span several time periods. It may also be utilized to show important financial and statistical data such as amount of sales and volumes of production.
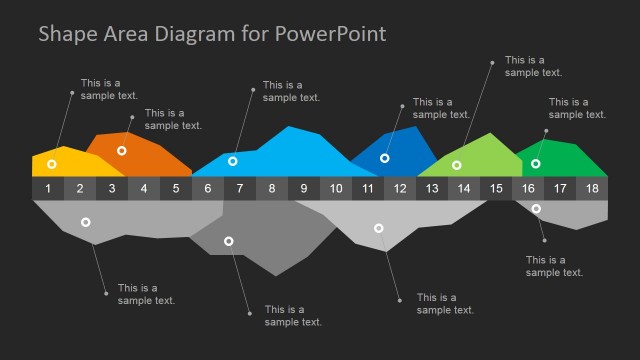
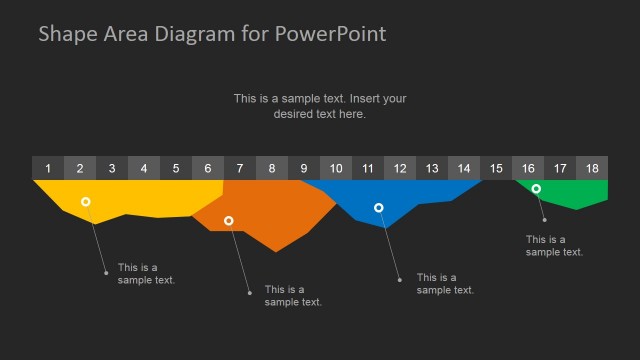
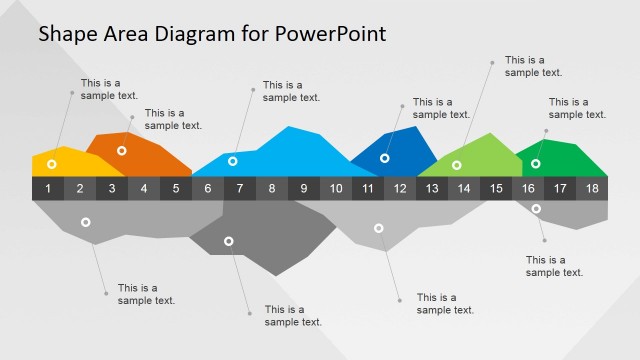
At the center of the PowerPoint slide is a rectangular strip, which is divided into eighteen segments, colored alternately in light gray and dark gray. The segments are numbered accordingly, from one to eighteen, with white text. The area charts, shown covering different time periods, are colored yellow, orange, light blue, dark blue, light green, and dark green. A summary of the presentation design, or a short descriptive statement, may be inserted in the text placeholder located at the bottom of the slide design. All PowerPoint objects are 10% editable to fit the presenter’s needs and preferences.
Return to Dark Infographics Area Chart Template for PowerPoint.