Creative Curved Bars PowerPoint Chart for Business
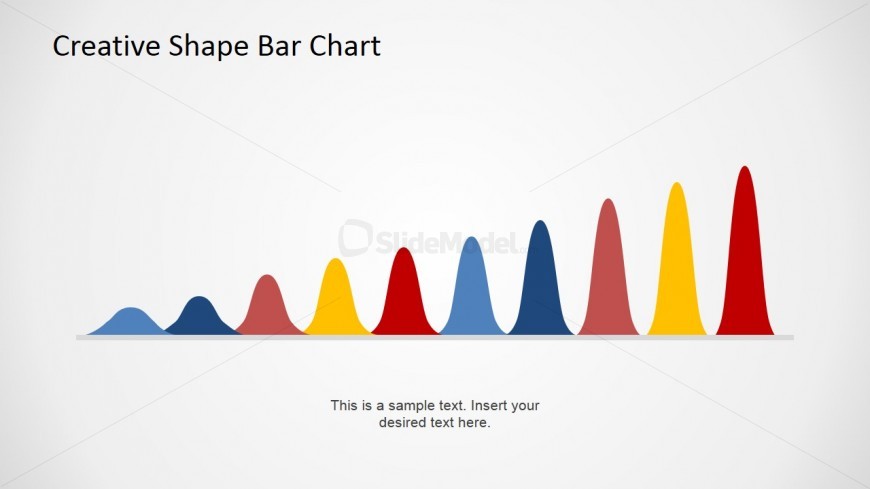
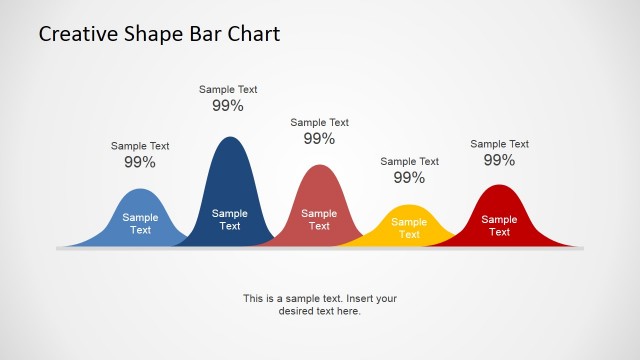
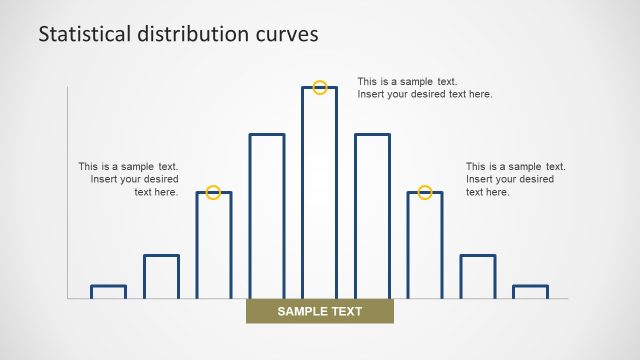
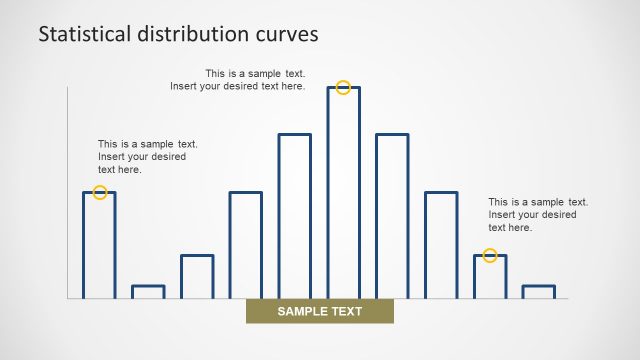
The slide design features a creative curves bars PowerPoint chart for business, which may be used to compare different financial and statistical data across several periods or departments found within the business organizations. The PowerPoint slide may also be used to inform key members of the company about vital financial information in order for them to align their goals accordingly.
The PowerPoint template features a set of ten curved bars in an increasing horizontal progression. They are colored in a pattern of light blue, dark blue, rose pink, yellow, and red, and vary in both width and height. At the bottom of the PowerPoint diagram is a text placeholder where a summary or brief explanation of the presentation design may be placed. The PowerPoint objects may be modified to suit the presenter’s needs and preferences as they are 100% editable.
Return to Creative Wave PowerPoint Shape.
Download unlimited PowerPoint templates, charts and graphics for your presentations with our annual plan.
DOWNLOADReturn to Creative Wave PowerPoint Shape.
