Positive Skewed as Bar Chart
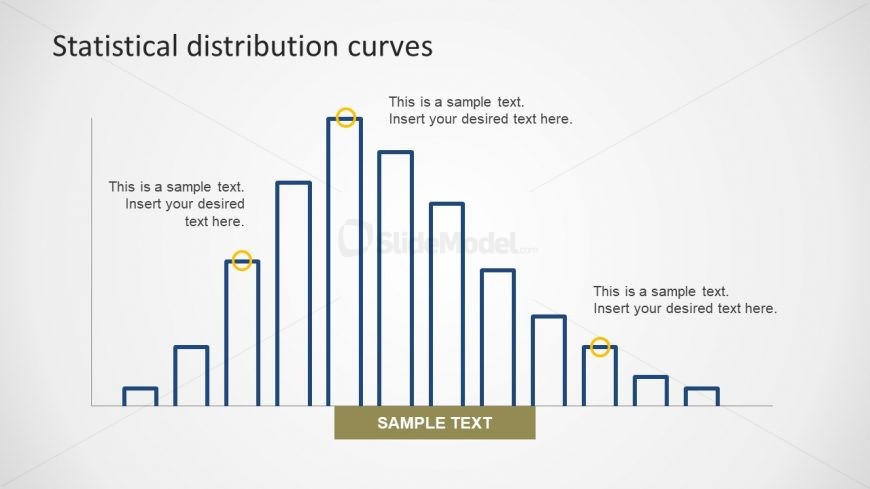
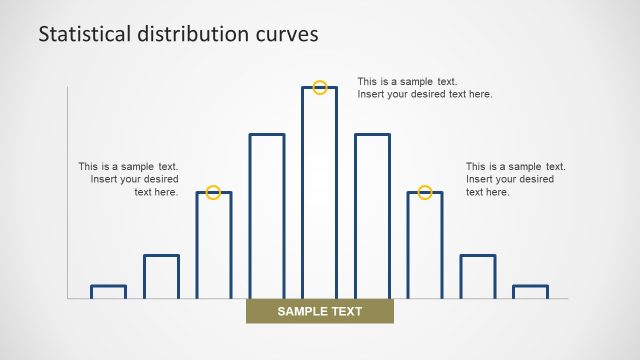
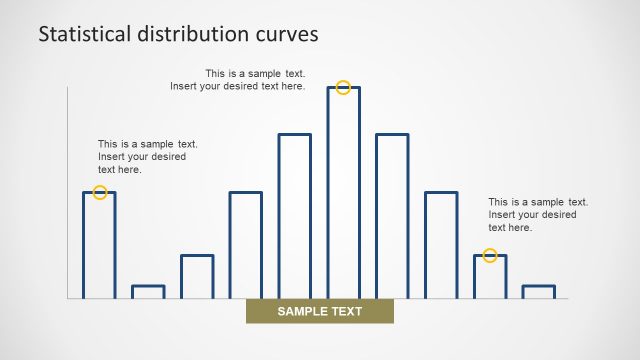
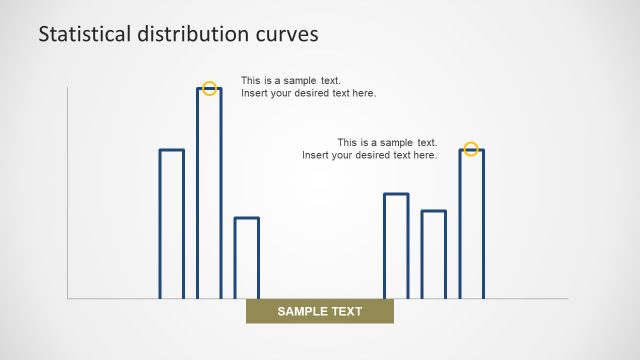
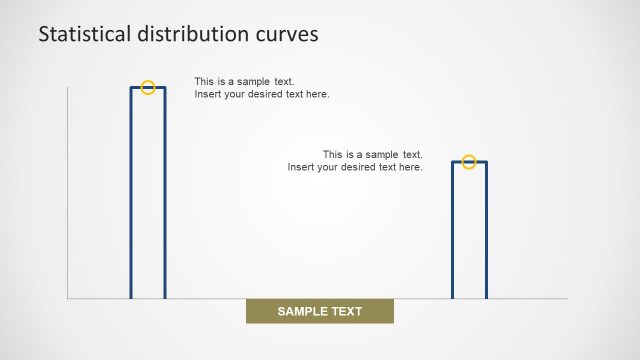
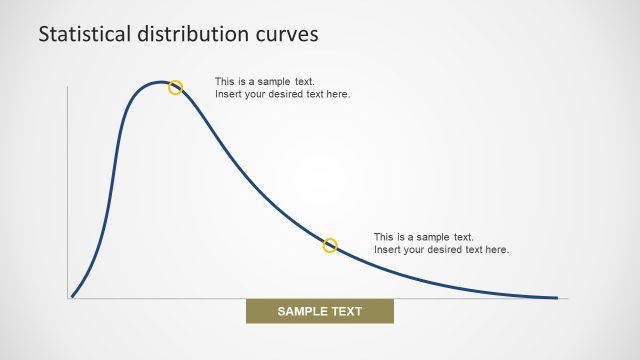
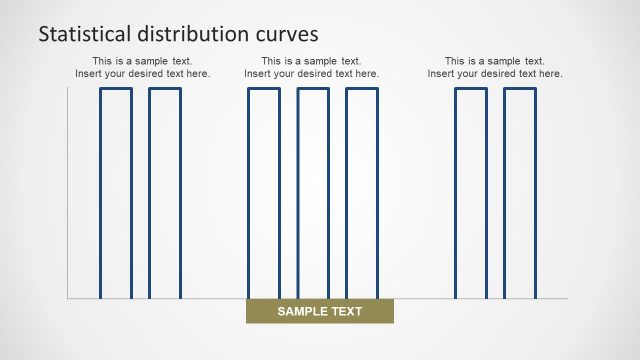
The slide template of Positive Skewed as Bar Chart is an asymmetrical distribution of data cluster towards one side. This is the normal distribution where the data is more drawn towards one side with most occurrence of events. Here this probability peak is on the right side, known as positively skewed. This PowerPoint is helpful to create charts for numerous purpose like social impact of project. The other applications include, scientific, engineering etc. The editable template lets users customize graph, background and text placeholders. Also, the PowerPoint lets the users increase and decrease the size of bars.
Return to Statistical Distribution PowerPoint Curves.