Wave Sound PowerPoint Template for Business
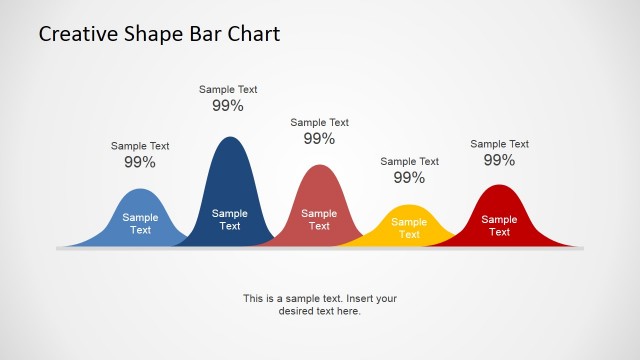
The PowerPoint template for business contains PowerPoint graphics which resemble sound wave readings. The PowerPoint template may be used to show the different probabilities of important estimates, such as customer volume, across several time periods, as the PowerPoint graphics can be utilized as bell curves to show probability distribution. It may be used in business presentations so as to estimate the corresponding purchase orders and working hours to be projected for the succeeding fiscal periods.
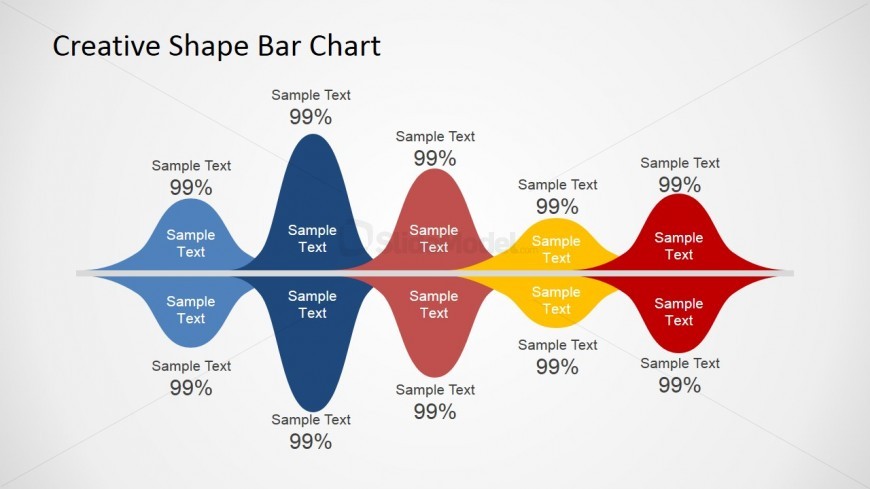
Featured on the PowerPoint slide are ten bell curves, show in pairs, with one mirroring the other below. Each pair is may be colored in light blue, dark blue, rose pink, yellow, or red. The bell curve PowerPoint shapes, which vary in both width and height, also have corresponding text placeholders where the labels, descriptions, and numerical probabilities may be inserted. All PowerPoint objects are 100% editable to suit the presenter’s needs and preferences.
Return to Creative Wave PowerPoint Shape.