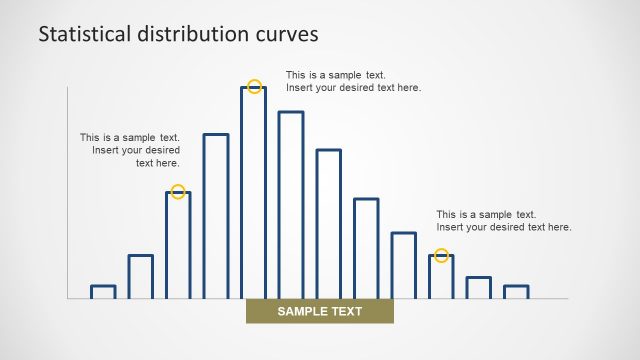
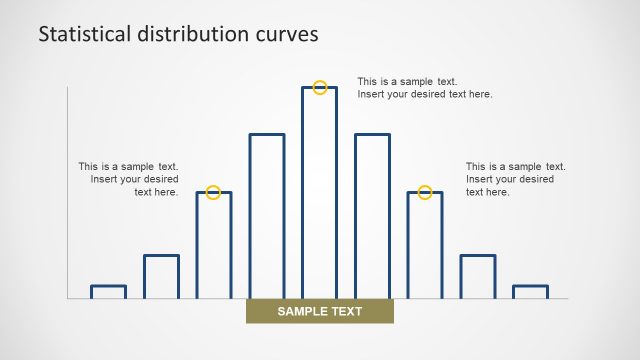
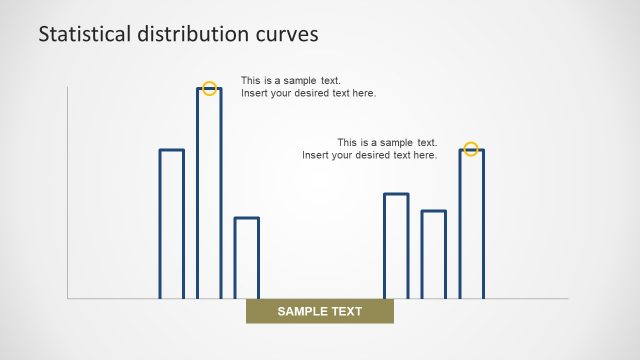
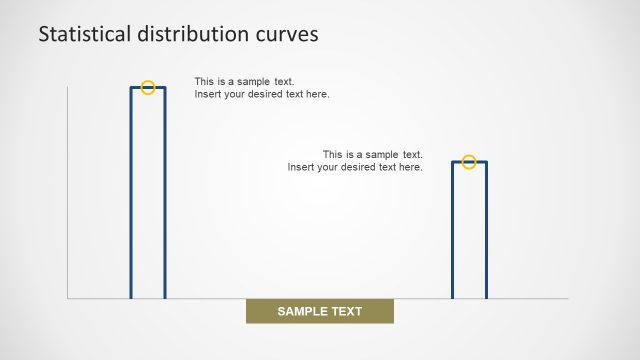
Multiple Bars Statistical Distribution
The Multiple Bars Statistical Distribution chart template is an awesome slide of bar graph. The rectangular bars length or height proportional represent values. Often, height of bars uses to display the probability of events in vertical view. Use for the bar chart usually shows the comparison of multiple categories. This graph is useful in analysis reports, such as financial, technical to explain the sales or marketing. The PowerPoint slides is an editable chart which lets users make changes like bar colors and background. Also, resize the bars by dragging the shape up and down and update graph.
Return to Statistical Distribution PowerPoint Curves.