Creative Customer Journey Funnel Diagram for PowerPoint
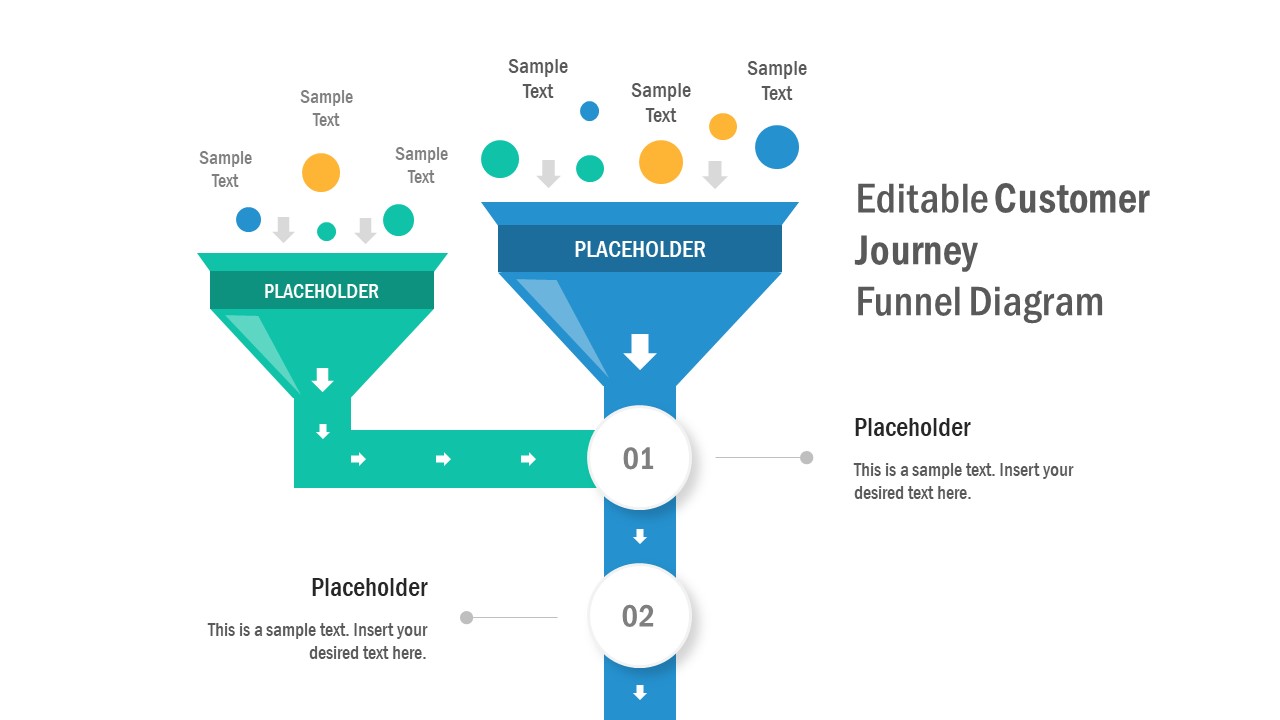
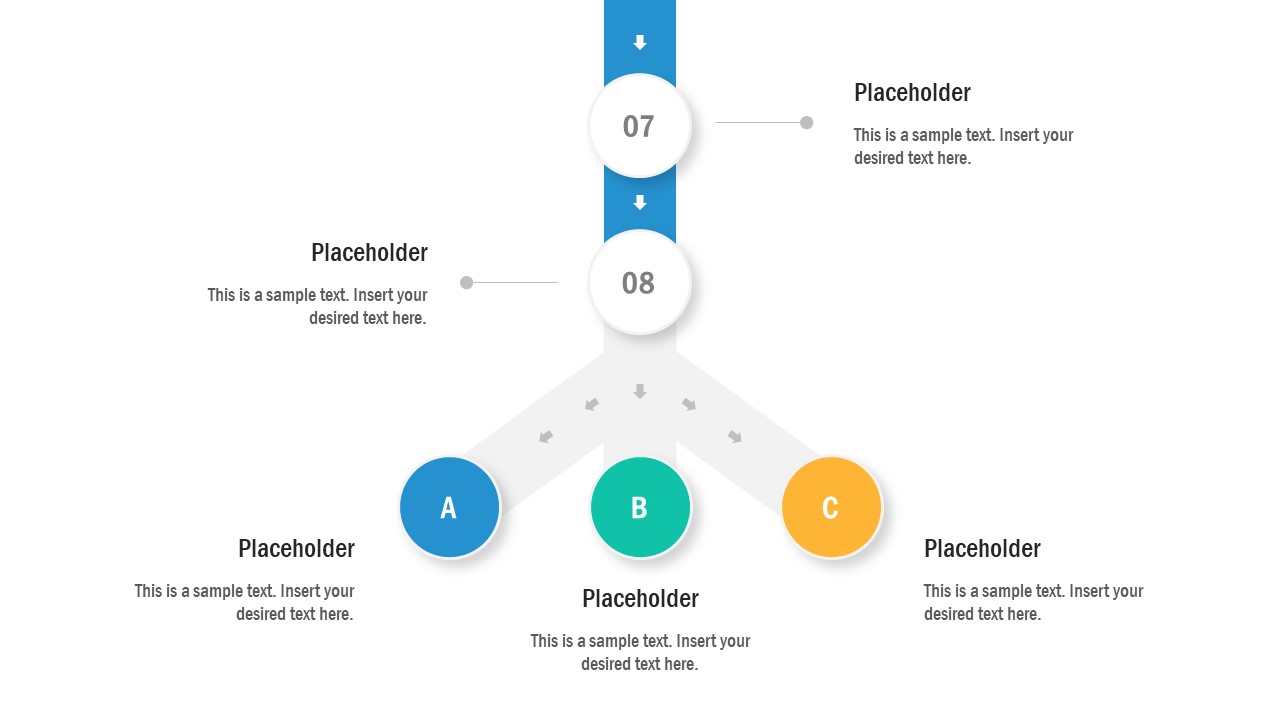
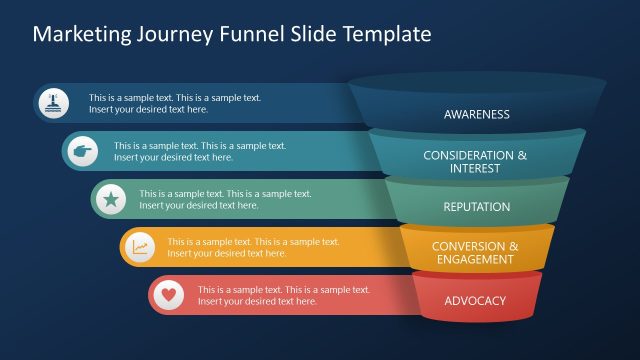
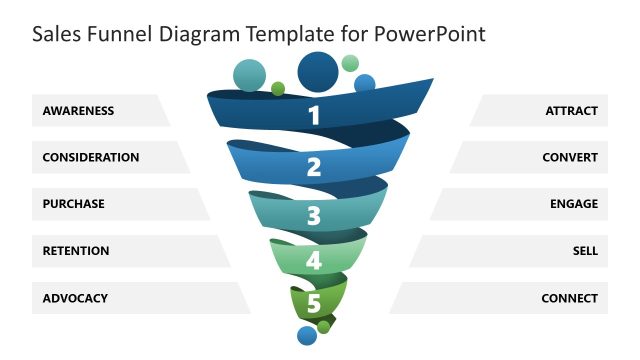
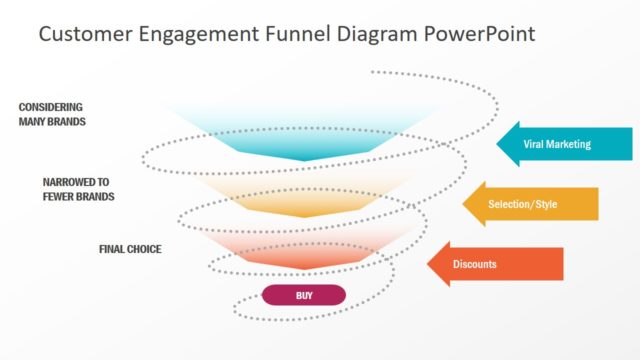
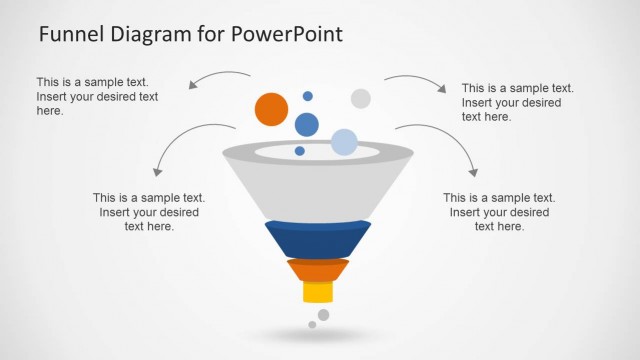
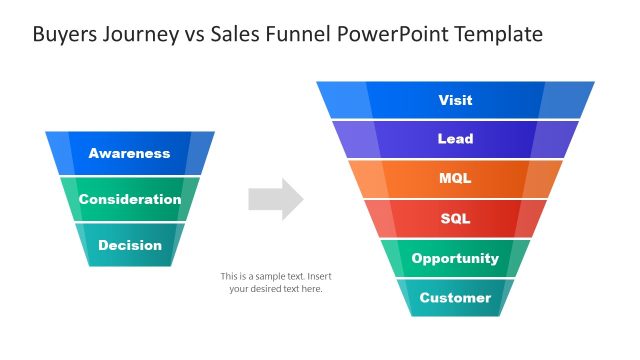
The Creative Customer Journey Funnel Diagram for PowerPoint presents two individual funnels. The PowerPoint diagram illustrates the data processing from two sources into one. This funnel diagram could be used to understand customer behavior and experience at different stages. It will further assist businesses to improve their processes and models to cater customer’s requirements. Therefore, it is an ideal PowerPoint to describe customer journey and target market through two funnels. The funnels are metaphor for processing multiple data values to get a unique outcome. However, this customer journey PowerPoint funnel gives three separate outcomes. Furthermore, the funnel chart PowerPoint use pipe design to visually represent strategies to distinguish leads.
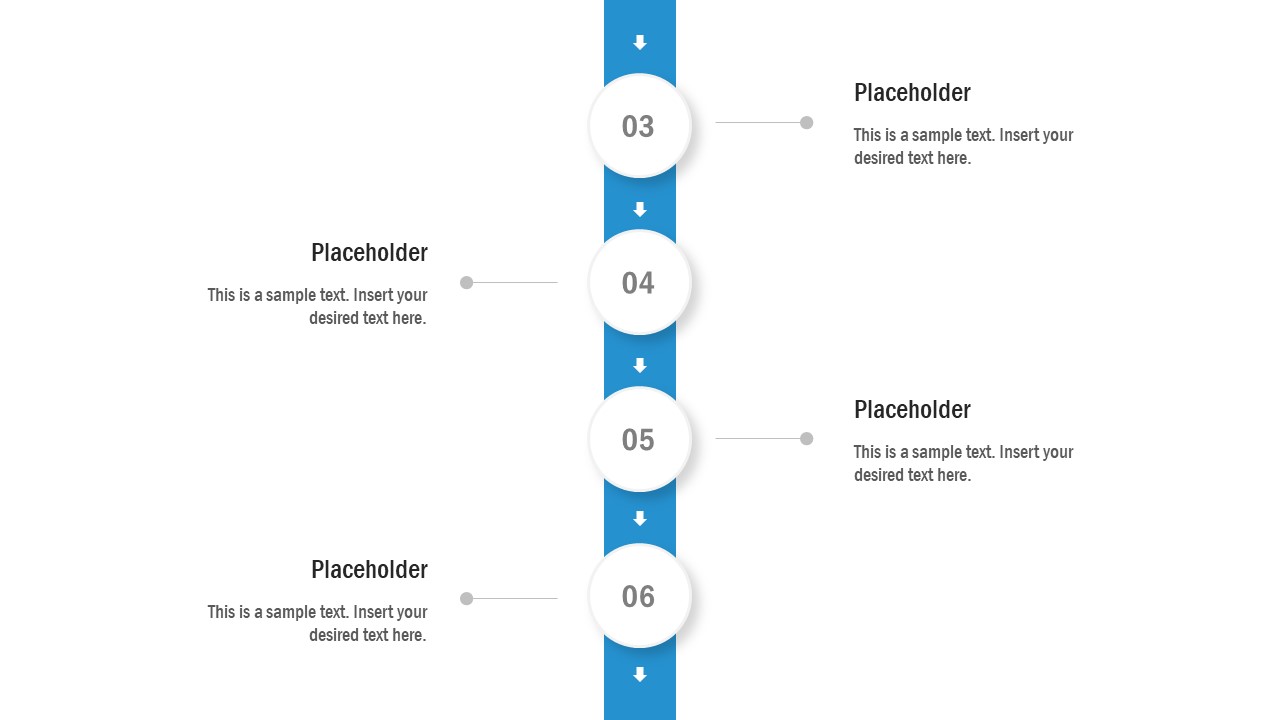
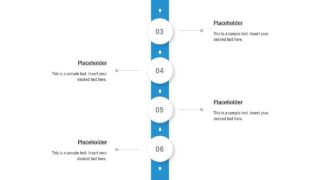
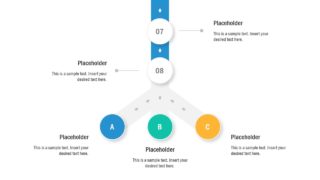
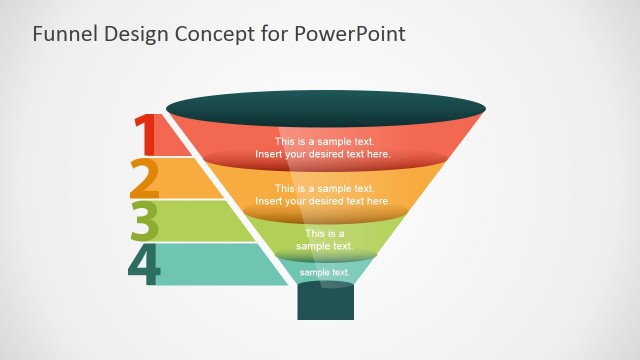
The template of customer journey is a creative 3 slides PowerPoint of funnel diagram. These slides display 8 steps funnel diagram in three sections with the help of slide transition effects. In this way, the audience can clearly view three separate portions of diagram. Here, first slide displays blue funnel shape as a main process diagram. Whereas, the outcome of additional green funnel goes into blue funnel at step 1. This diagram is 8 steps PowerPoint funnel with 3 data sets as output.
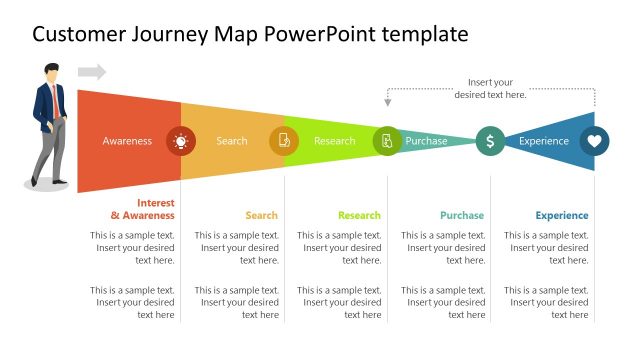
The Creative Customer Journey Funnel Diagram for PowerPoint presents story of customer experience from first interaction. The PowerPoint funnel diagram is an editable template of colorful shapes and graphics. The users can customize these graphics since these slides are a collection of editable PowerPoint shapes. Moreover, they can add animations along with slide transitions and insert text or graphics.
