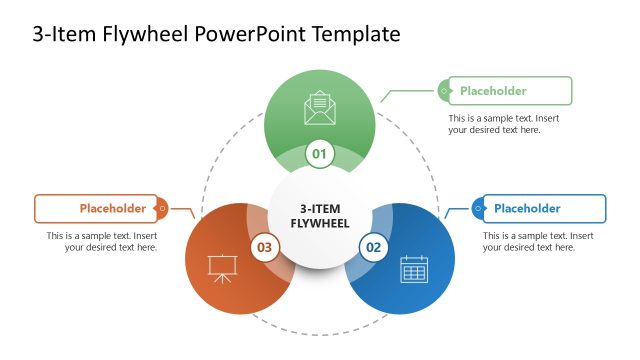
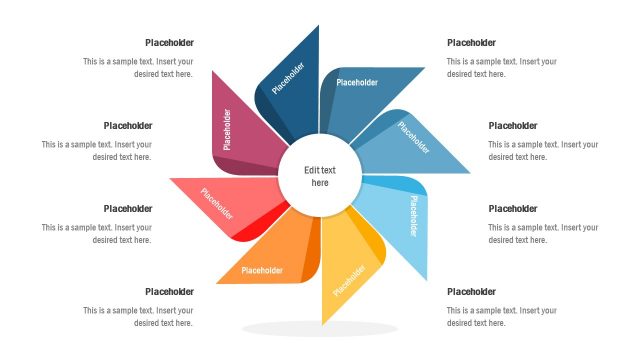
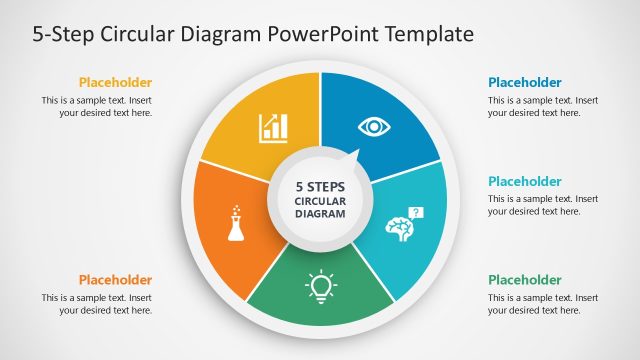
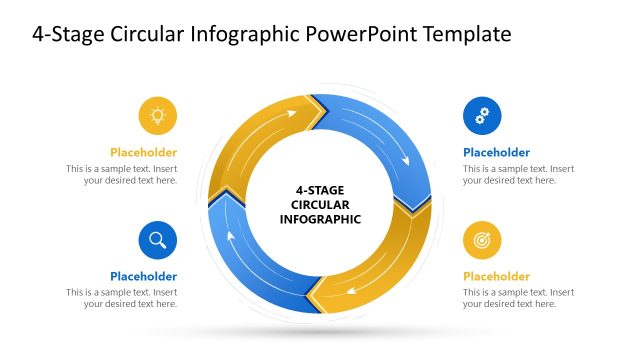
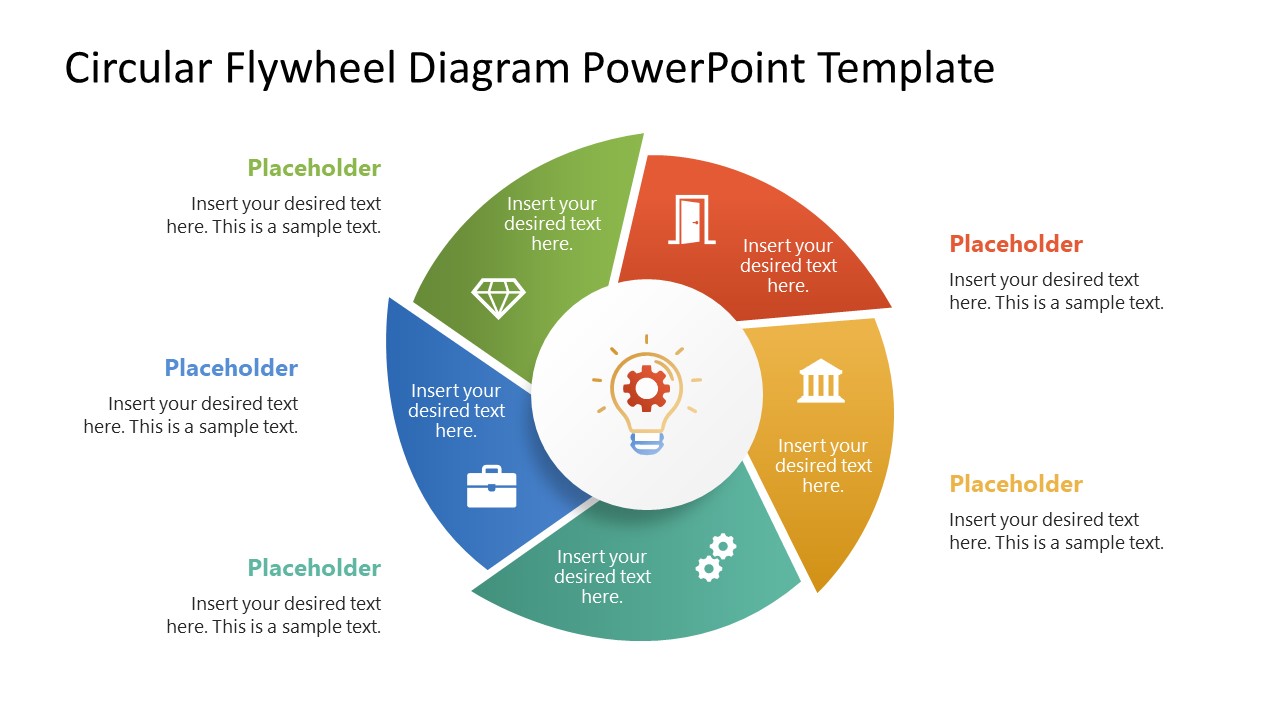
Showcase continuous growth cycles in your stakeholder presentations with our Circular Flywheel Diagram PowerPoint Template. The flywheel starts rotating and, after a while, returns to its starting point. That’s why the flywheel diagram is used in business presentations to illustrate repetitive, multistage processes. QA engineers use the segmented flywheel diagram to highlight the key steps to ensure the product meets its quality standards. Project managers use the circular flywheel in their team presentations to highlight the deliverables submission process to the teams. They can display the five conditions that must be checked stepwise every time a project is delivered. Product developers share their coding and development processes in client presentations and build credibility with a circular infographic design. The flywheel diagram makes it easier for the audience to grasp the information.
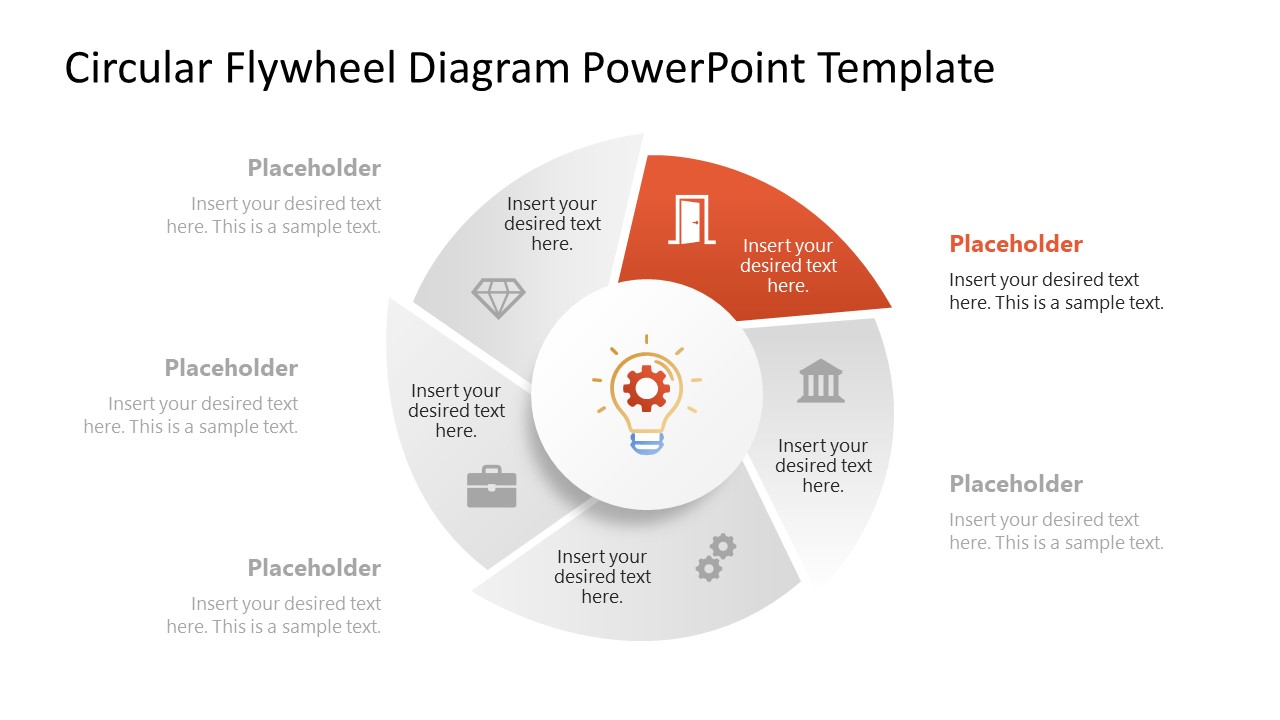
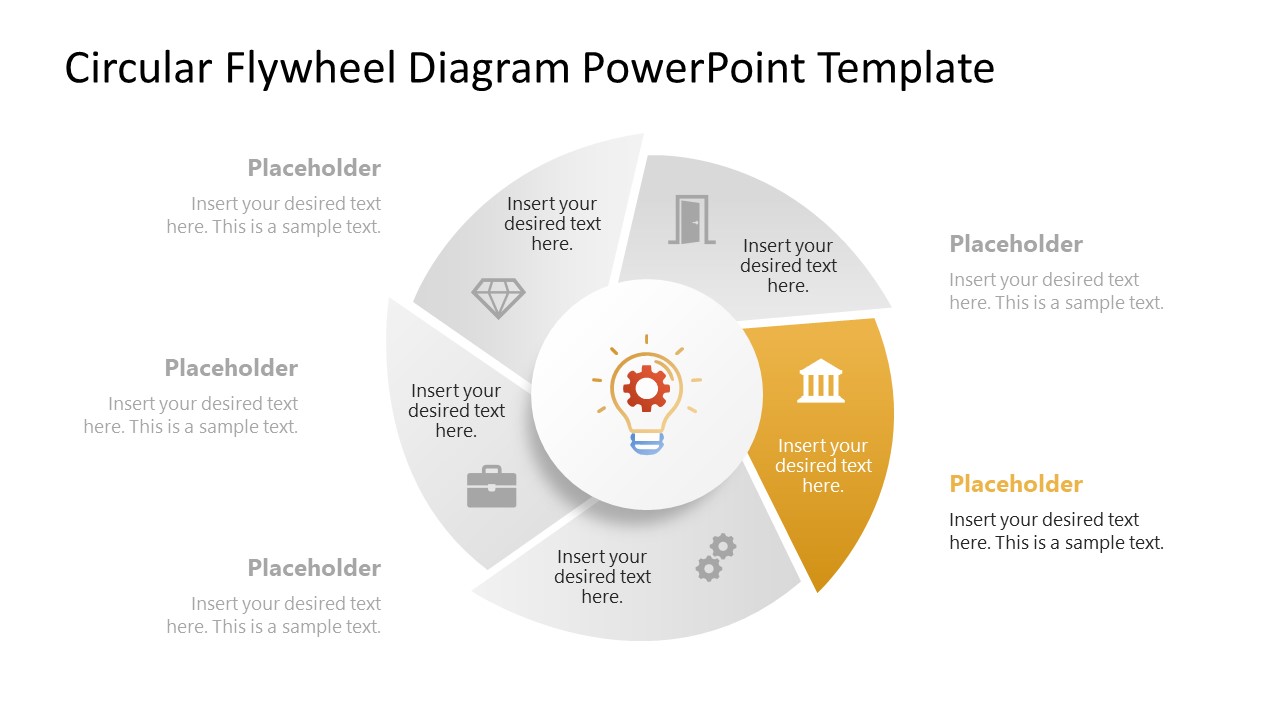
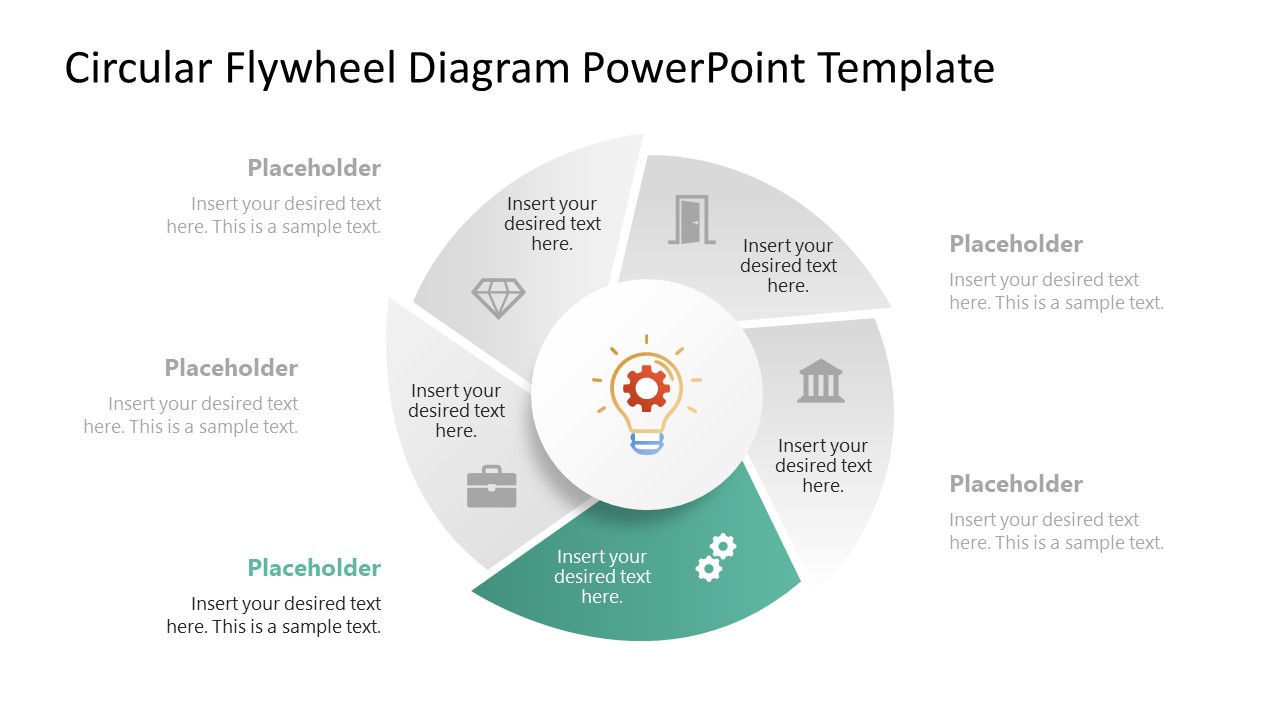
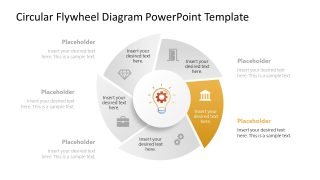
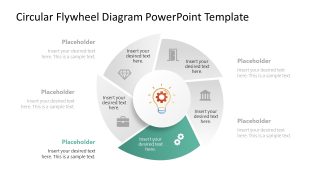
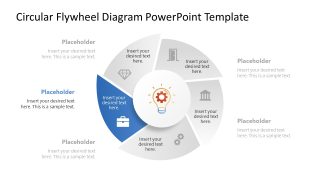
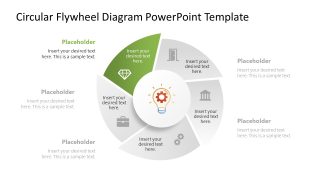
In addition, we allow users to adjust the graphical arrangement of the design, the sizes of shapes, and the colors and icons used in the PowerPoint layout. The Circular Flywheel Diagram PowerPoint Template comprises multiple slides. On the cover slide, marketing managers showcase the 5-day event-campaign process. In the following slides, they can use the same diagram with a focus effect to present each stage separately, with appropriate details. Each segment is similar to a flap and contains placeholders for text and icons, enabling users to outline their topic clearly. Operations managers discuss the 5 steps of continuous process improvement models in their quarterly stakeholder presentations. This circular flywheel diagram template enables strategy directors to deliver a structured presentation that communicates self-reinforcing systems, feedback loops, and cyclical models.
Download the circular flywheel diagram PPT template for your strategy presentation. Or visit our collection of circular diagram templates to find the version that best suits your needs.
What’s inside this template
Example presentation scenarios
- An operations manager can present a continuous improvement model by opening with the full flywheel and then using the segment focus slides to explain each recurring step.
- A product manager can describe a product development loop to clients by assigning each flywheel segment to discovery, build, review, launch, and feedback content.
- A QA lead can brief engineering teams on a repeated validation process by using the grayed-out stages to keep context while focusing attention on the current checkpoint.
- A marketing manager can outline a five-step campaign cycle by replacing the segment icons and callouts with campaign planning, launch, measurement, optimization, and reporting details.
Features
- 100% editable presentation template
- Compatible with Microsoft PowerPoint
- 16:9 aspect ratio slides
- Scalable vector shapes, icons and illustrations
- AI-Ready for Microsoft Copilot and Claude
- Instant access and download
Frequently asked questions
Q: How should a presenter explain a five-stage process with this flywheel?
A: Start with Slide 1 to show the complete cycle before discussing any single stage. Then move through the focus slides so each colored segment becomes the main point while the gray segments preserve the loop context. Keep the outer callouts short and action-oriented so the audience sees how each step feeds the next.
Q: Who is this template best suited for?
A: This template fits presenters who need to explain repeatable systems rather than linear plans. Operations managers, QA leads, product managers, and marketing teams can use the five-segment flywheel to show recurring checks, campaign cycles, delivery routines, or feedback loops where every stage contributes to the next rotation.
Q: Why use a flywheel diagram instead of a numbered list?
A: The circular flywheel metaphor makes recurrence visible. A numbered list can imply that the process ends after the final item, while this layout shows momentum, return, and reinforcement. The focus slides add control because the presenter can discuss one segment in detail without losing the audience's sense of the whole cycle.


Circular Flywheel Diagram PowerPoint Template
6-slide presentation template for five-segment flywheel diagrams, process cycles, and stage callouts
Circular Flywheel Diagram PowerPoint Template is a 6-slide diagram deck for Microsoft PowerPoint. It includes a complete five-segment circular flywheel, individual segment focus slides, icon placeholders, and surrounding text callouts. Operations, product, QA, marketing, and strategy presenters can explain cyclical processes using editable PowerPoint shapes and vector icons.
- Category
- Diagrams
- Rating

 Loading...
- Aspect ratio
- 16:9
- Item ID
- 23657-01
- Colors
 Microsoft PowerPoint
  Microsoft Copilot
  Claude for PowerPoint
 Other formats supported
Subscribe today and get immediate
access to download our PowerPoint templates.