Slide 3 of 5 from 3D Risk Coverage PowerPoint Template
Insurance and Coverage Concept PPT
3D Risk Coverage Diagram for Presentations
- Diagram
- Segmented Wheel
- Strategic Analysis Slide
- 16:9
- 100% Editable
What’s on This Slide
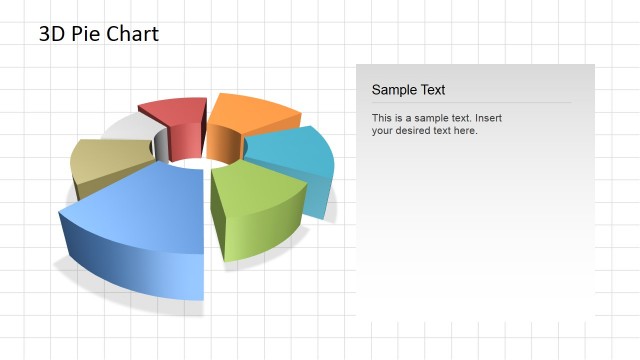
The slide features a 3D pie chart divided into six segments, each representing different data categories. The chart is centered on a light blue background, with a subtle gradient. Each segment has a distinct shade of orange or light peach, creating a visual contrast. Text placeholders are positioned around the chart, aligned to the left and right, allowing for data labels. The title is prominently displayed at the top in a bold font. The overall layout emphasizes the central pie chart while providing space for descriptive text.
How to Use It
This layout serves as a visual representation of risk categories, ideal for presentations on risk management or incident response. It fits well after problem identification slides and before detailed analyses. Business scenarios include insurance presentations, risk assessments, or incident management discussions. The structure allows for clear communication of multiple data points, making it suitable for summarizing key information in a visually engaging manner.
Text Placeholders & Capacity
Keep your copy within these limits so it fits without resizing. Node labels can accommodate around 30 characters each without overflow.
| Placeholder | Count | Max characters (approx.) |
|---|---|---|
| Item heading | 6 | 30 |
Slide Keywords
Download unlimited PowerPoint templates, charts and graphics for your presentations with our annual plan.
DOWNLOADReturn to 3D Risk Coverage PowerPoint Template.