Editable 3D Donut Chart for PowerPoint
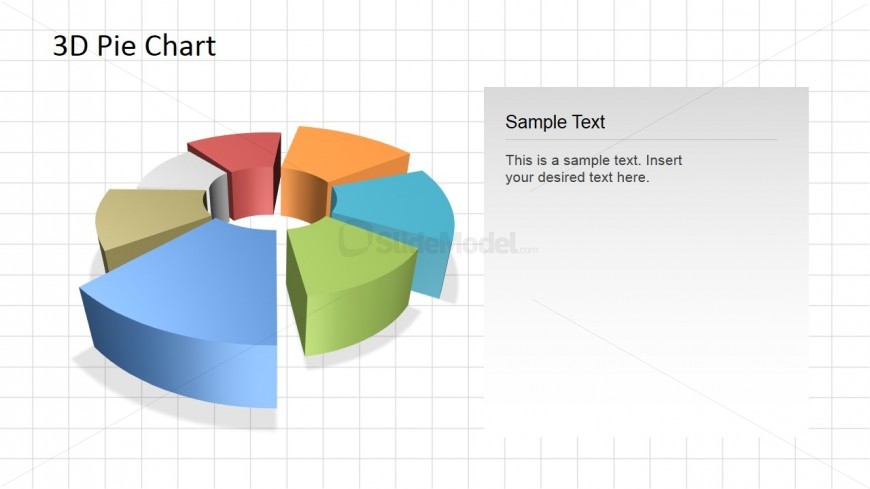
The main feature of this slide design is a 3D Donut Chart for PowerPoint designed to provide a more varied and visually-appealing version of a pie chart. This slide design may be used to show data involving percentages, as the donut chart functions as a pie chart. The PowerPoint objects are 100% customizable to suit the presenter’s needs.
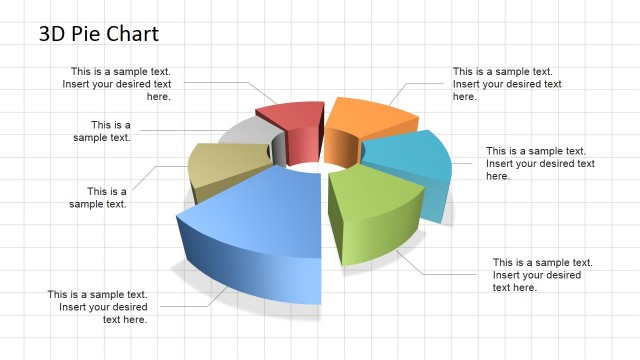
The 3D donut chart is divided into seven sections, colored orange, red, gray, brown, dark blue, green, and light blue. The dark blue section is emphasized by making it appear larger in comparison to the other sections. Beside the donut chart is a text placeholder with a blue gradient fill, where an explanation for the chart may be inserted. A title for the presentation may also be placed in the text placeholder found above the donut chart.
Return to 3D Pie Chart Diagram for PowerPoint.