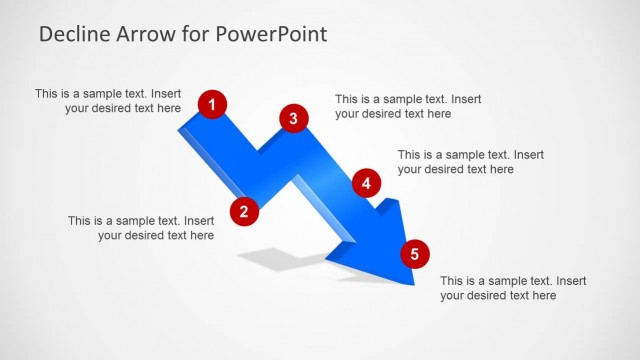
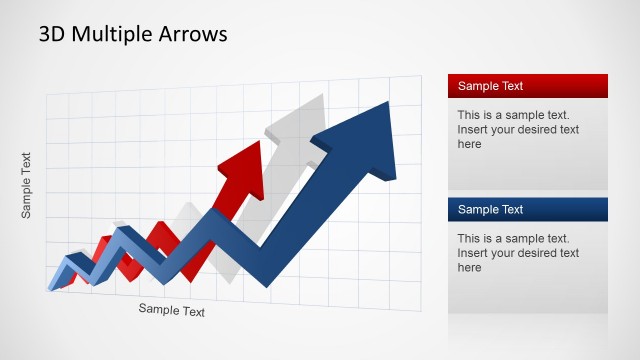
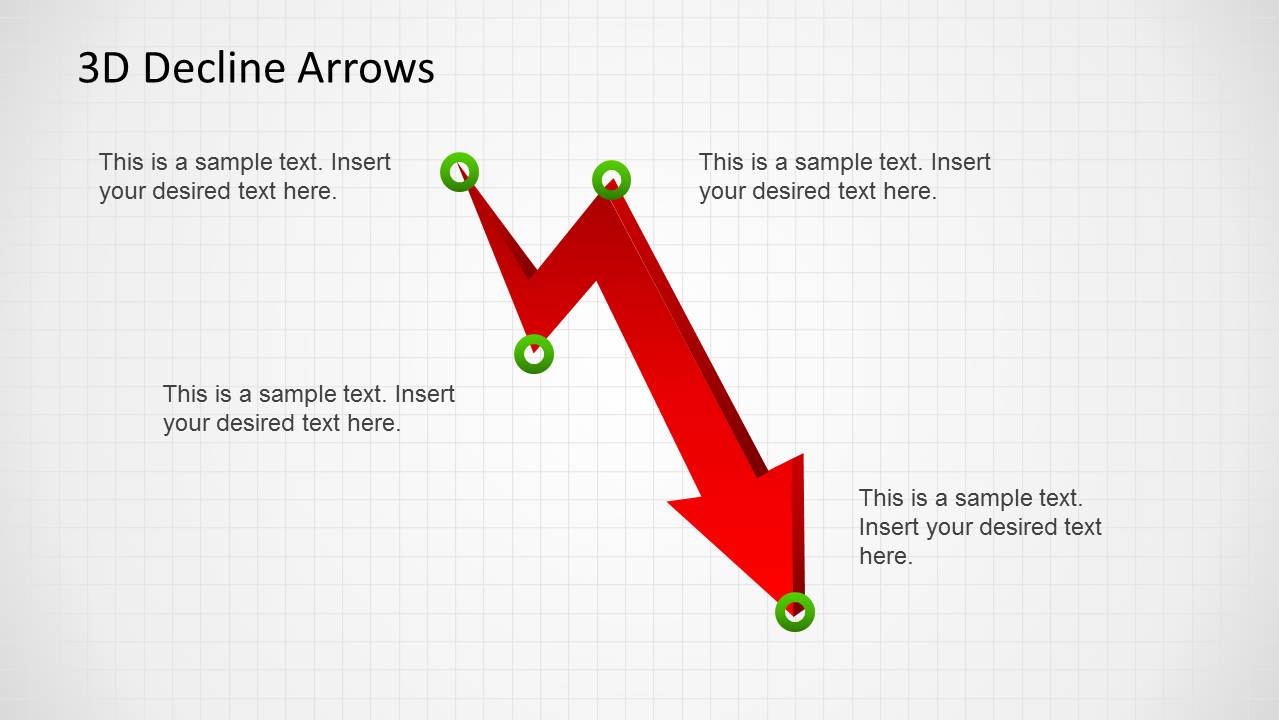
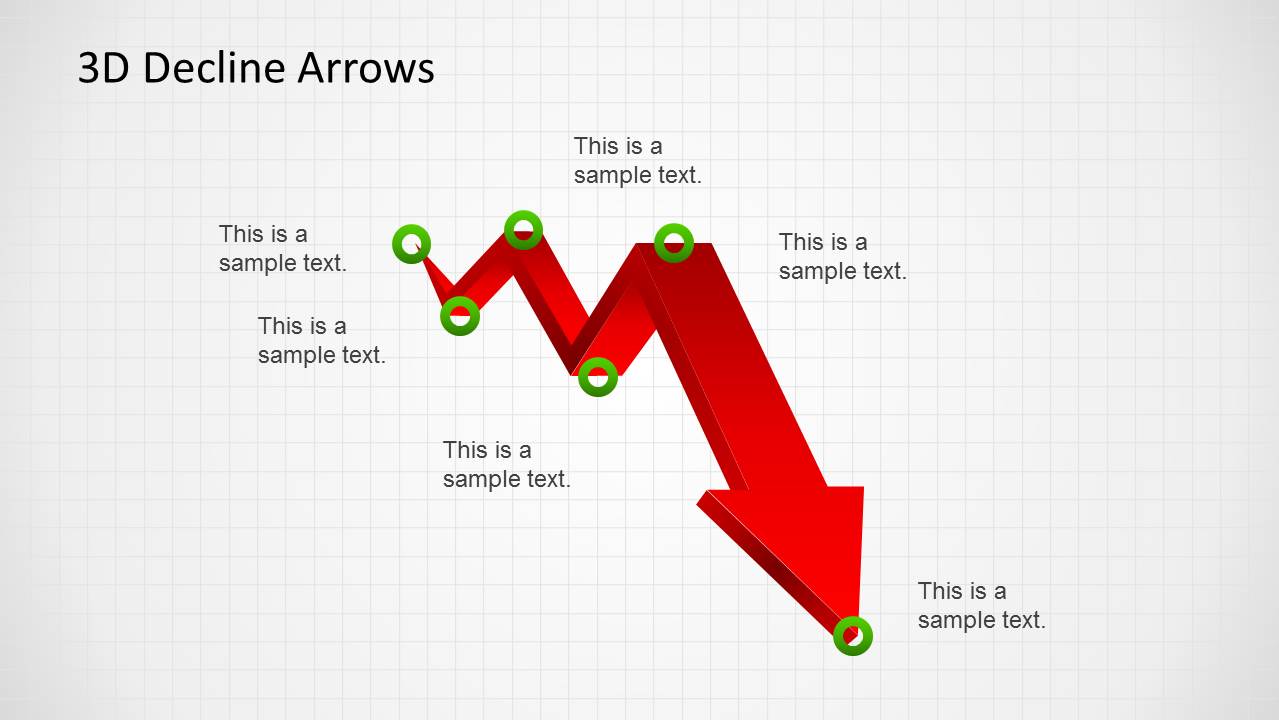
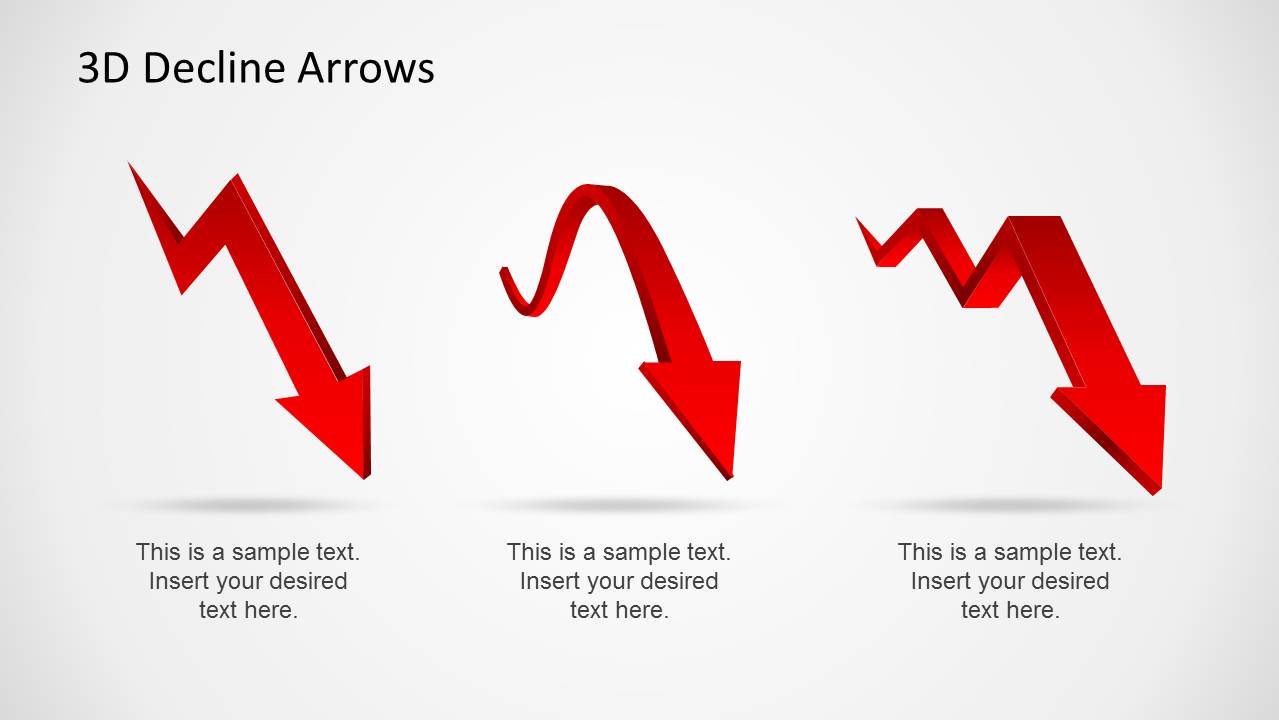
3D Decline Arrows Template for PowerPoint is a presentation design template for PowerPoint containing awesome 3D arrow shapes that you can use in presentations to show a decline situation, a crisis or downtrend. The 3D PowerPoint arrows can be used in PowerPoint presentations on Economics and Financial PowerPoint presentations. One of the slide designs shows a graph where the 3D arrow suddenly fall through the floor of the slide.
The red arrow for PowerPoint simulates a Thunderbolt effect that can be used to represent a crisis, recession or bankruptcy scenario in presentations on scenario analysis.
What’s inside this template
Example presentation scenarios
- A finance manager can use the zigzag decline arrow with right-side callout panels to explain falling revenue, margin pressure, or a negative forecast to executives.
- A risk analyst can use the grid-background slides with green point markers to walk stakeholders through the sequence of events leading to a crisis scenario.
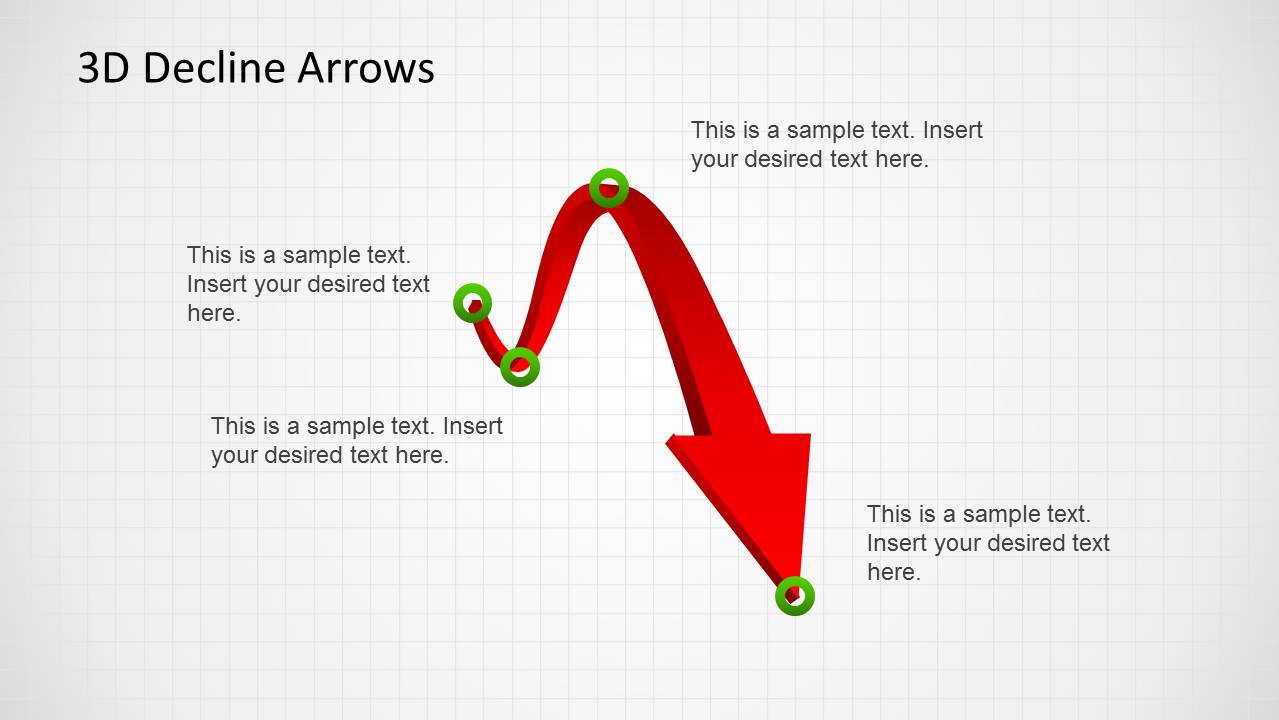
- A marketing analyst can use the curved falling arrow slide to present a drop in campaign performance, web traffic, or customer demand with two supporting causes.
- A consultant can use the three-column arrow comparison slide to contrast three decline patterns, such as gradual downturn, sudden crash, and repeated downswing.
Features
- 100% editable presentation template
- Compatible with Microsoft PowerPoint and Google Slides
- Scalable vector shapes, icons and illustrations
- AI-Ready for Microsoft Copilot and Claude
- Instant access and download
Frequently asked questions
Q: How should a presenter communicate the decline without making the slide feel alarmist?
A: Use the large red arrow as the headline visual, then keep the text panels factual and brief. Pair one cause with one implication per callout. On the marker slides, explain the sequence point by point so the audience sees the logic behind the downturn instead of reacting only to the dramatic symbol.
Q: Who is this template best suited for in a business presentation?
A: It is best for presenters who need to explain negative movement quickly: finance teams reporting missed targets, economists discussing recession signals, marketers showing demand decline, or consultants framing a bankruptcy or crisis scenario. The arrow metaphor works when the audience needs a clear directional message before reviewing details.
Q: Why does the 3D downward arrow metaphor work for crisis and recession topics?
A: The thick red 3D arrows create an immediate visual cue for loss, urgency, and downward momentum. The grid slides add analytical structure through point markers, while the text-panel slides provide space for causes and consequences. This balance helps the presenter move from emotional recognition to reasoned explanation.









3D Decline Arrows Template for PowerPoint
7-slide PowerPoint presentation template with 3D decline arrows, crisis callouts, and downtrend markers
3D Decline Arrows Template for PowerPoint is a 7-slide template for explaining negative movement, crisis, or downturn scenarios. It includes a 3D zigzag decline arrow with text panels, grid-background annotation slides, curved falling arrows, and a three-option arrow comparison for finance, economics, marketing, and risk presenters.
- Rating

 Loading...
- Item ID
- 6306-01
- Colors
 Microsoft PowerPoint
  Microsoft Copilot
  Claude for PowerPoint
 Other formats supported
Subscribe today and get immediate
access to download our PowerPoint templates.