Downward Trend PowerPoint Template
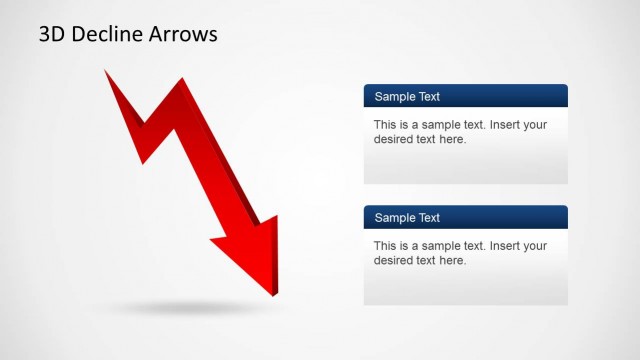
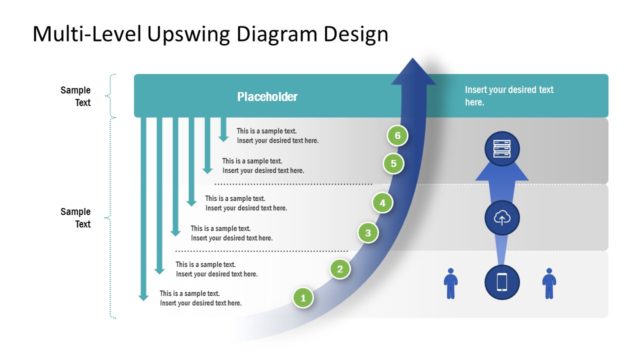
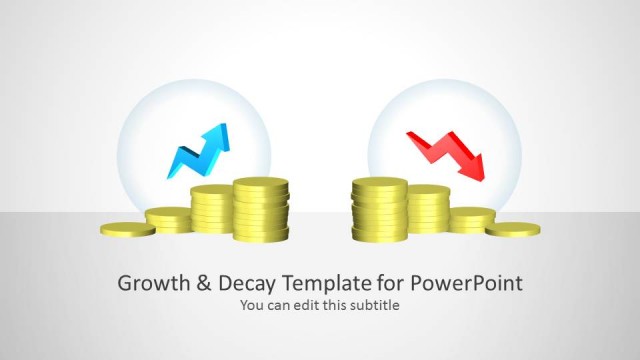
The Downward Trend PowerPoint Template is a 5 steps horizontal graph with infographics. This is a business template for managers and leaders to demonstrate a decrease which could be financial decline or failing risks. The template shows a 3D graph chart indicating downward trend or failing values. This graph is a flat vector PowerPoint shape in red-ribbon style. It further contains circular infographic units on each peak. These icons can help define the events or decisions which affect this trend graph chart.
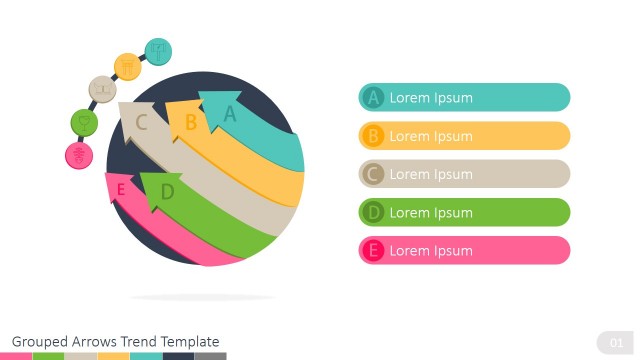
The red color here depicts alarming situations since downwards trends are often used to explain decline in business growth. However, users can change the color of the downward trend graph from shape-fill in drawing format. The twist in ribbon style graph is a separate shape which can help users to customize each element individually. Apart from trend chart diagram, this template offers a collection of 32 useful infographic icons. The users can replace icons in diagram with multiple options available.
The Downward Trend PowerPoint Template highlights 5 segments as areas of grouping. And, text placeholders to add useful business information. These trend chart slides are ideal in demand and supply and economic model presentations.


You must be logged in to download this file.
DOWNLOAD- Category
- Diagrams
- Rating


 Loading...
- Size
- 16x9
- Item ID
- 7960-01
- Colors
Subscribe today and get immediate
access to download our PowerPoint templates.