Business Diagrams
Learn how to make creative business slides for presentations with editable business diagrams ready for Microsoft PowerPoint. Our blog posts show how to edit to of the line PowerPoint Templates in order to match the users required outcome. Also, a set of tutorials show the reader professional edition techniques to take the most from PowerPoint.
How to Skew an Image in PowerPoint
Mastering how to skew an image in PowerPoint isn’t a daunting task. Learn the two methods that will speed up your techniques.
Swimlane Diagrams for Presentations
Swimlane diagrams are essential visual tools for mapping processes, roles, and workflows in a clear and organized manner. Often referred to as a swimlane flowchart or swimlane process map, these diagrams use lanes to assign tasks to specific participants or departments, making them ideal for presentations that aim to clarify responsibilities, optimize processes, or drive […]
What is an Euler Diagram and How to Make One
If you aim to represent relationships between elements using mathematical models, we highly recommend you to learn how to use Euler Diagrams. Follow up this guide for definitions, step-by-step process, and tools to use.
How To Insert Swimlane in PowerPoint
Swimlane diagrams may seem challenging to create, but in reality, they are a powerful tool to express processes that can be handled with professional PowerPoint templates. Learn step-by-step how to create your own swim lane diagram in PowerPoint here!

A Comprehensive Guide to Strategic Planning for Success
Every organization has grand goals on their business agenda. However, there is a long way between formulating those goals and seeing the results of their successful accomplishment. A lot of things can happen in-between, the project can get side-tracked, the timeline may change and new threats may emerge. To get a better sense of what needs to be accomplished and how? Most managers regularly engage in strategic planning.
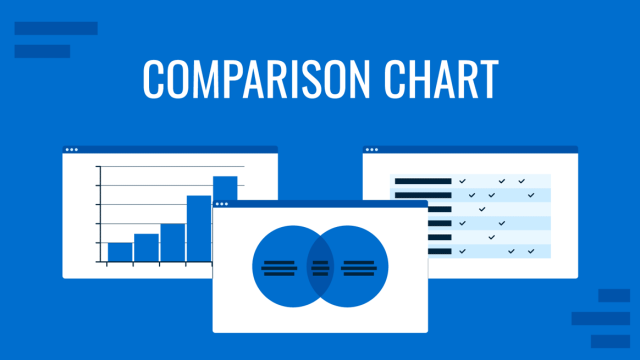
Comparison Chart: A Step-by-Step Guide to Making Informed Decisions
A visual comparison between different topics, items, or events can be easier to follow for an audience than the information provided in plain text. Different types of comparison charts are often used for this purpose. These charts are used in publications, presentations, websites, advertisements, etc. Table of Contents What is a Comparison Chart A comparison […]
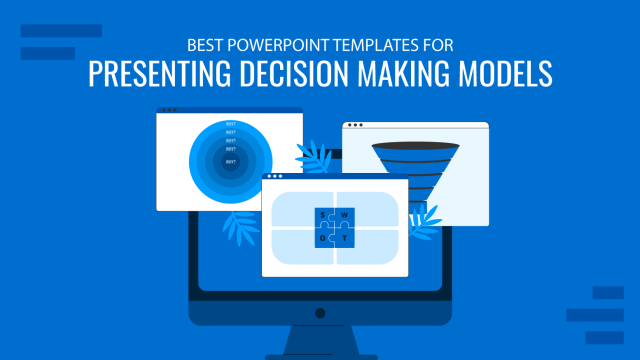
Best PowerPoint Templates for Presenting Decision Making Models
Different decision-making models are used to cater to the various needs of a business. In this article, we review some of the best decision-making models available.
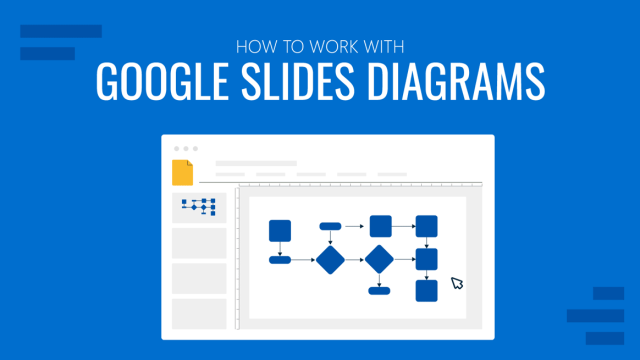
How to Insert and Edit Google Slides Diagrams
While many people use Google Slides templates for making presentations with diagrams, Google Slides also provides a set of diagrams similar to PowerPoint SmartArt. These diagrams can help create timelines, grids, processes, relationships, and other types of diagrams. Unlike Google Slides diagram templates, these are simplified versions of basic diagrams. How to Use Diagrams for […]
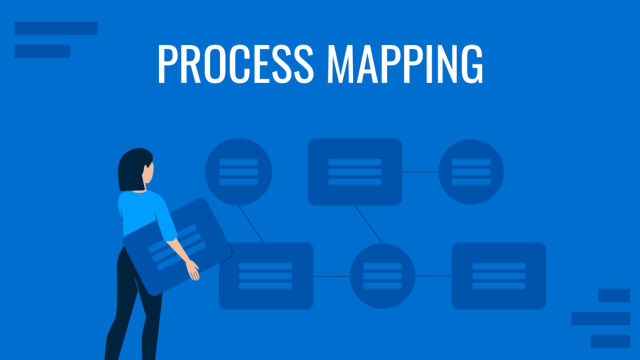
What is Process Mapping? (Strategies + Templates)
Discover how much of an invaluable tool can process mapping become for your organization. Guide + selected PPT templates.
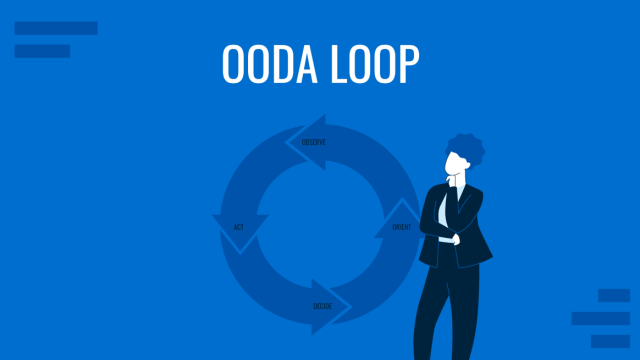
The OODA Loop Decision-Making Model and How to Use it for Presentations
OODA Loop is a model that supports people and companies when defining important decisions in teams or individuals. See here how to apply it in presentation slide design.
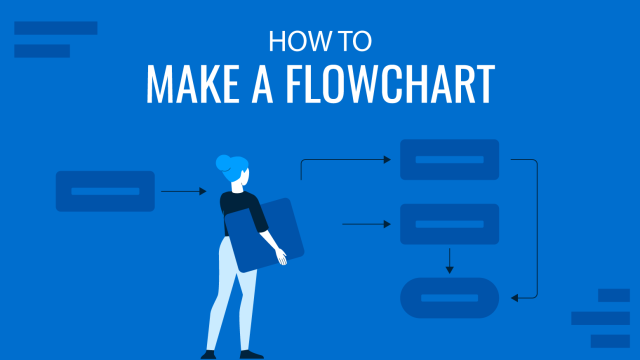
Complete Guide on How to Make a Flowchart (Examples + Templates)
Flowcharts are constructed to design and document such procedures. This article explores the best ways to make flowchart presentations, examples, design tips, and suggested PowerPoint flowchart templates.
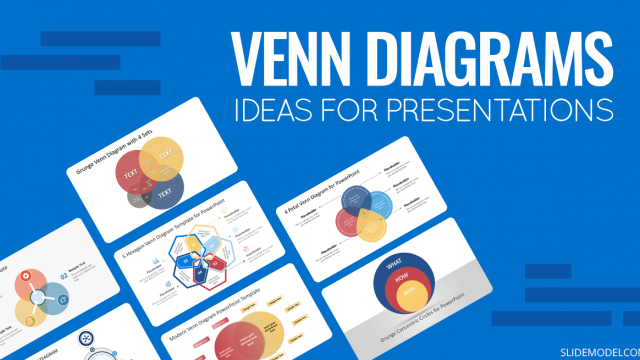
Venn Diagram Ideas for PowerPoint Presentations
In this article, you will learn the basics of Venn diagrams, how they can be used in presentations and what type of information they are recommended for.