In every organized endeavor, whether business, academic research, engineering, or nonprofit work, there comes a point when stakeholders must stop and ask, “Where do we stand?” The answer often lies in a well-crafted progress report. Designed to document what has been accomplished, what remains pending, and where potential problems lie, a progress report presentation transforms raw data and task updates into meaningful insight. It provides transparency and facilitates decision-making while aligning team members, sponsors, or investors.
This article aims to provide an in-depth guide on how to write a progress report, how to present it effectively, and how to adapt its structure based on audience, timing, and purpose. We’ll walk through examples, explore formats, and clarify distinctions such as status report vs progress report. You’ll also discover the essential differences between daily, weekly, and monthly progress reports and learn how to adapt progress report templates to meet specific needs.
Table of Contents
- What is a Progress Report?
- What is a Progress Report Presentation?
- Types of Progress Reports: Choosing the Right Approach
- Progress Report vs Status Report
- The Structure and Format of a Progress Report Presentation
- How to Deliver a Progress Report Presentation
- Recommended Progress Report PPT Templates
- FAQs
- Final Words
What is a Progress Report?
A progress report is a formal document that provides a detailed account of the work completed, work in progress, and challenges encountered within a specific period. It is typically used in projects, research, business operations, and organizational initiatives to keep stakeholders informed about ongoing developments. Unlike a general status report, a progress report connects current achievements to the original objectives, evaluates whether milestones have been met, and outlines what still needs to be done.
The core function of a progress report is to foster transparency, accountability, and informed decision-making. It allows teams to track whether timelines and budgets are being adhered to, provides justification for delays or changes in scope, and signals when intervention may be necessary. Most progress reports include key components such as an overview of objectives, completed tasks, ongoing work, encountered problems, and next steps. The tone is typically professional, objective, and data-driven, although it may also include qualitative insights when appropriate.
What is a Progress Report Presentation?
A progress report presentation is the verbal and visual communication of a project or task’s ongoing status, delivered in a structured format to an audience of stakeholders. Unlike written progress reports, which can be submitted for review, presentations offer real-time engagement, enabling immediate feedback, questions, and clarifications. This format is ideal for project review meetings, executive updates, client check-ins, and team briefings, where active dialogue and shared understanding are crucial.
The purpose of a progress report presentation is to summarize achievements, highlight current activities, explain obstacles, and outline the next steps. It typically follows the same basic structure as a written progress report, including an introduction to goals, a review of completed deliverables, an analysis of any delays or issues, and a projection of future tasks. However, in presentations, this information is often condensed into slides and reinforced with charts, timelines, vector images, and key performance indicators to support data visualization and storytelling.
Recommended lecture: Data Presentation
An effective report presentation does more than convey data; it helps build trust and credibility. The speaker’s delivery, clarity, and ability to anticipate questions are as important as the content. Presenters must ensure they’re not only sharing what has happened but also why it matters and how it impacts overall objectives. In many cases, this format is also used to gain stakeholder approval for new phases, resolve bottlenecks, or reassign resources.
Types of Progress Reports: Choosing the Right Approach
There is no universal progress report format, as each report should respond to the project’s pace, audience, and nature of work. However, the most common categories fall into three temporal classifications: daily, weekly, and monthly progress reports.
Daily Progress Report
The daily progress report is primarily used in high-frequency operations such as manufacturing, construction, IT incident tracking, or logistics. Its primary goal is to log short-term outputs, identify immediate obstacles, and support continuous handoffs across shifts or teams. Due to its frequency, it tends to be brief and focused on operational data rather than analysis.
Weekly Progress Report
The weekly progress report provides a broader picture and is commonly used in agile environments, marketing campaigns, research labs, or any workplace where short sprints are the norm. Weekly reports not only help managers monitor pacing but also enable reflection on evolving priorities. A weekly progress report may touch upon task completions, obstacles, coordination issues, and upcoming goals. It can also include lightweight metrics and early indicators of trouble.
Monthly Progress Report
In contrast, a monthly progress report serves a strategic function. It provides trend analysis, connects metrics to overarching objectives, and flags scope changes. This type of report is typically used for executive reviews, client meetings, and board updates. It relies heavily on data visualization and narrative synthesis to explain fluctuations in budget, time, and resource allocation. A monthly progress report is an essential document in any governance or performance review cycle.
Progress Report vs Status Report
There is frequent confusion around the terms’ status report ‘vs’ progress report’. Though both aim to inform, they differ in depth and purpose. A status report is often short, periodic, and intended for immediate tactical decisions. It may include lines like “Project is on track” or “Task X was completed today.”
Recommended lecture: Project Status Report Presentation
A progress report, on the other hand, provides a broader narrative. It explains why a delay occurred, what was learned, how it impacts the future timeline, and what support is needed. It often involves the use of visual presentation aids, historical comparisons, and a forward-looking perspective. It is a management tool, not just a tracking log.
Understanding these distinctions ensures that you choose the correct format for the right moment. Use progress reports for strategic updates and status reports for daily or quick-check communications.
The Structure and Format of a Progress Report Presentation
Understanding how to do a progress report correctly starts with knowing its presentation structure. Although different organizations and industries may impose specific formats, there are common components that form the backbone of any effective project progress report. As an example, we’ll use the Generic Progress Report Presentation Template to illustrate the different slides required.
Introduction
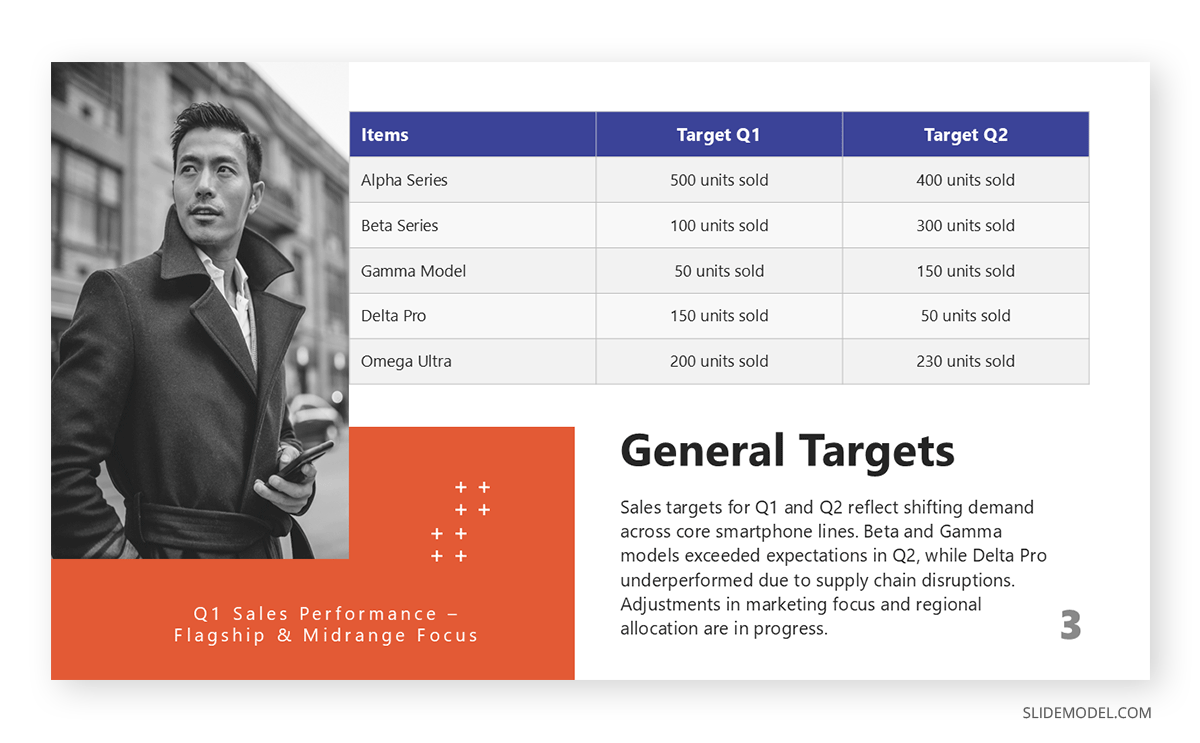
The introduction typically outlines the report period, the subject of the project, and the author or reporting party. This framing provides basic context for interpretation. The second section outlines the objectives or goals that had been defined for the reporting period. These are usually drawn from the original plan or roadmap. When these objectives are explicitly stated upfront, it becomes easier to track variances later.
Recommended lecture: How to Start a Presentation
Accomplishments/Milestones
Next comes the detailed narrative of accomplishments and milestones reached. This is the core of the report of progress and structures how to make a presentation around it. It should clearly distinguish between completed tasks and work still in progress.
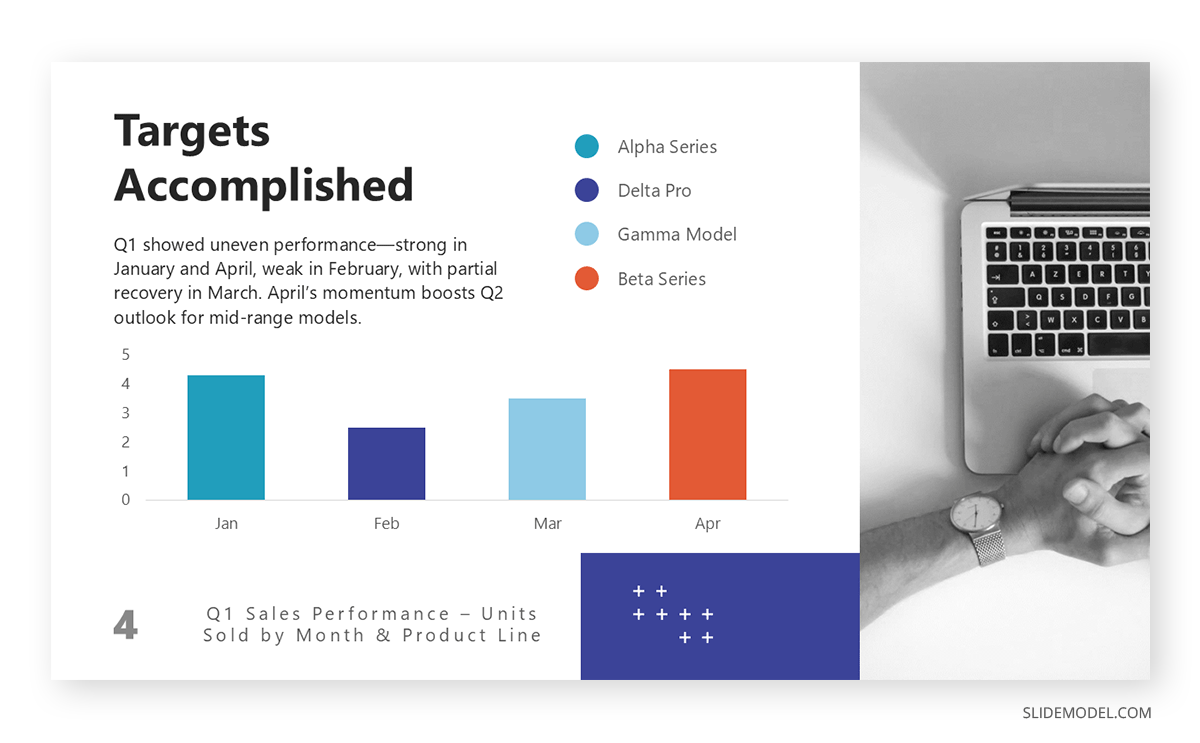
Ideally, this section will integrate metrics, such as completion percentages or time usage, along with brief commentary on the quality of the outputs. In technical fields, this may also include testing results or code deployment summaries.
Challenges/Mitigation Strategies
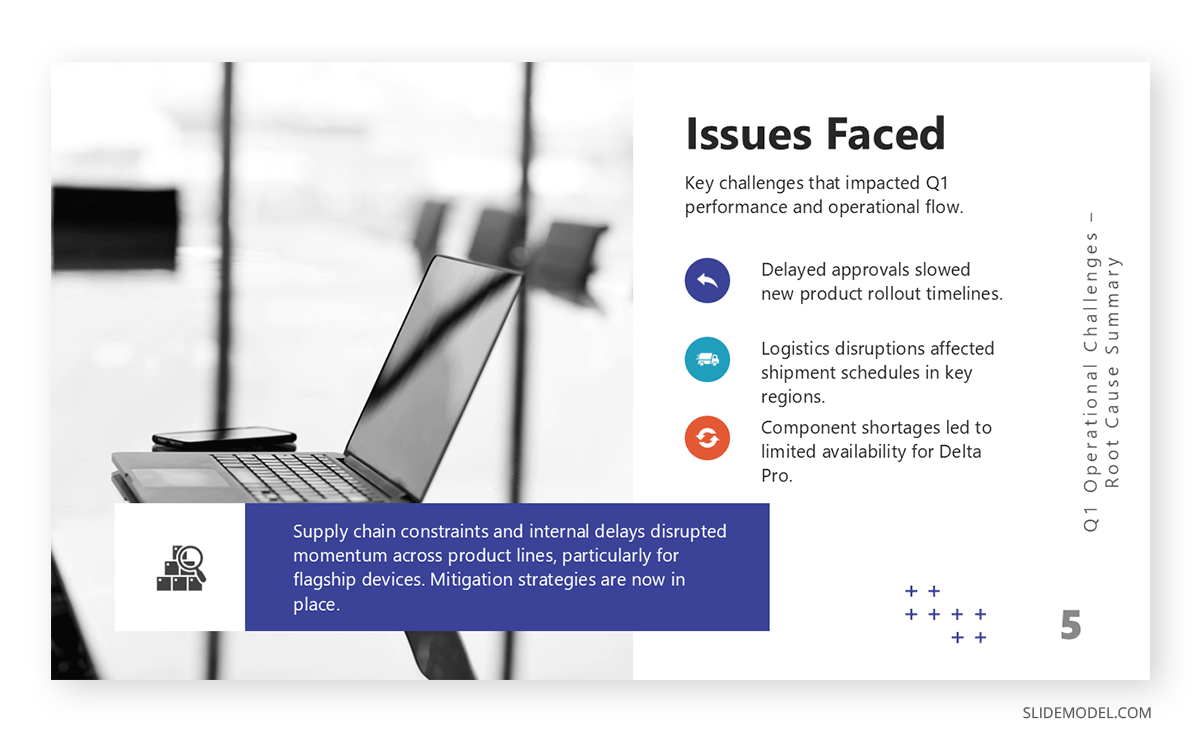
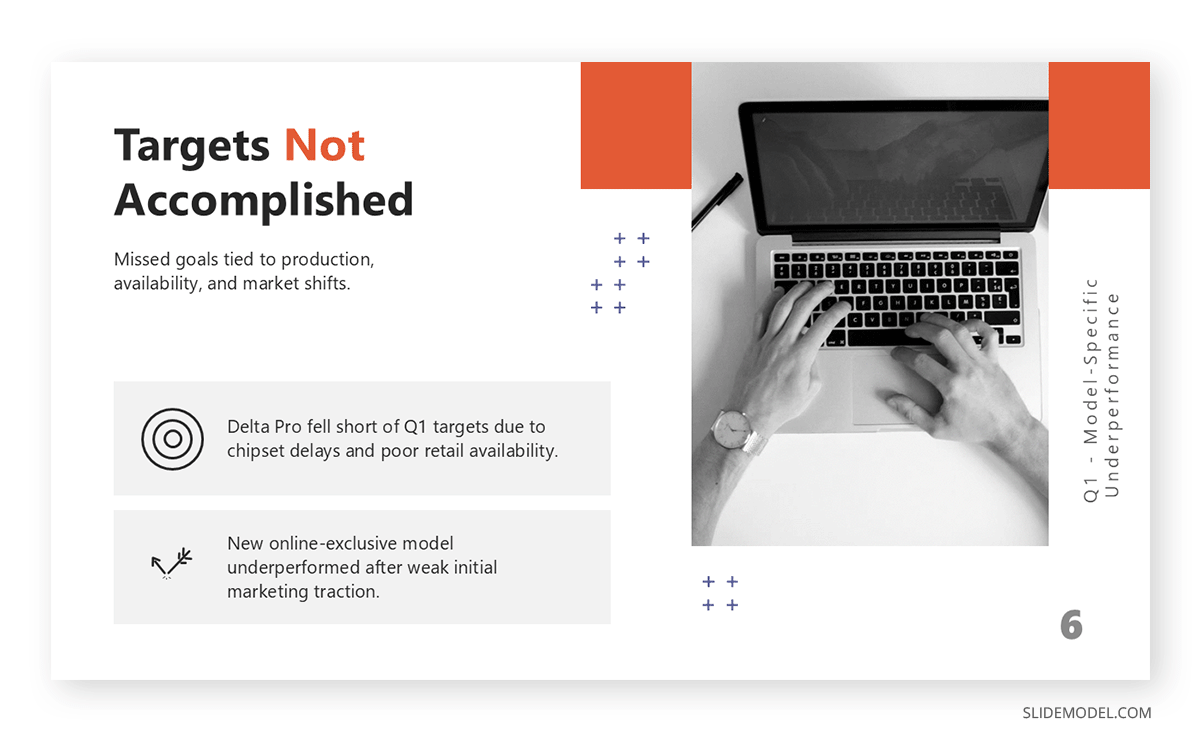
Another vital section addresses challenges, obstacles, and mitigation strategies. A good progress report sample doesn’t hide failure; instead, it communicates problems transparently and explains corrective actions. This fosters trust with stakeholders and provides a realistic assessment of project health.
Recommended lecture: Risk and Mitigation Slide
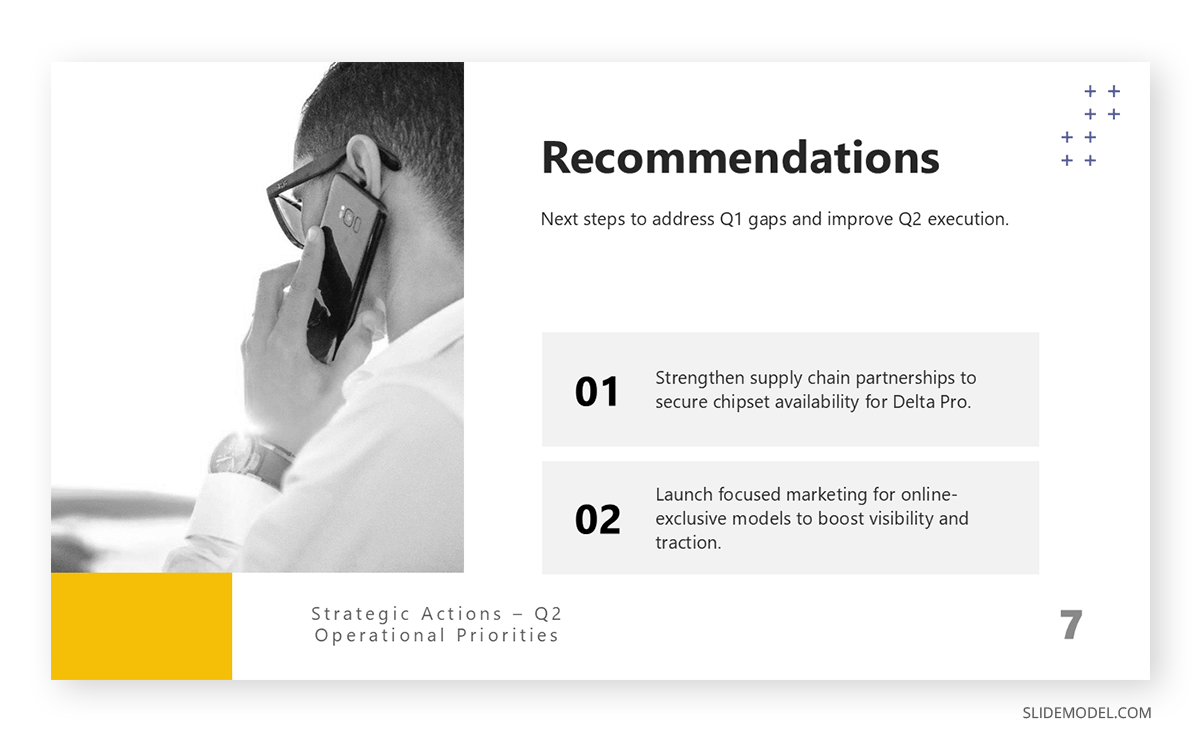
Next Steps/Recommendations
The final sections include next steps and recommendations. These not only outline the immediate work plan for the next period but also highlight any approvals, escalations, or decisions required from leadership.
When it comes to the format progress report layout, the delivery medium, whether a PDF, slide deck, email, or shared document, determines how information should be presented. A PowerPoint version may rely more on visuals and fewer words, while a written Word document provides more room for technical details and nuanced explanation. Choosing the correct progress report format ensures the message is both digestible and impactful, and progress report PowerPoint templates help us speed up the decision-making process for both the presentation layout and delivery files.
At the moment we choose how to end the presentation, we prioritize the KPIs tracked with key recommendations and what will be done immediately or is required to inform future actions. We can add an extra dashboard slide to remind stakeholders of the main information to make data-backed decisions.
Recommended lecture: Data-Driven Decision Making
How to Deliver a Progress Report Presentation
Presentation transforms static information into a dynamic story. It allows you to control the narrative, respond to feedback, and build trust. Start your presentation by setting the scene. Briefly restate the goals and the timeline. This reorients the audience and allows them to calibrate their attention.
Then walk through the achievements. Use visuals where possible. If your team finished a design sprint, show a prototype. If you hit a revenue target, display the graph. A visualized progress report example is more memorable and convincing than a text-heavy one.
Midway through, transition to challenges. Don’t rush or gloss over this part. Addressing setbacks with honesty builds credibility. Describe what went wrong, how it was resolved, and what preventive measures have been put in place.
Close with a strong presentation summary. Outline next steps and request specific support or decisions if needed. Invite questions. An excellent progress report presentation becomes a two-way dialogue rather than a one-sided broadcast.
Recommended Progress Report PPT Templates
A good template reduces friction in report creation and ensures that key elements are not overlooked. It supports standardization without eliminating flexibility. For instance, a weekly progress report template might include predefined fields for completed tasks, blockers, time estimates, and action items, while allowing comments or images to be inserted freely.
In this section, we’ll list down our selection of PowerPoint & Google Slides progress report templates. All these designs are 100% editable and can be repurposed for any other content format.
1. Business Progress Report Slides for PowerPoint
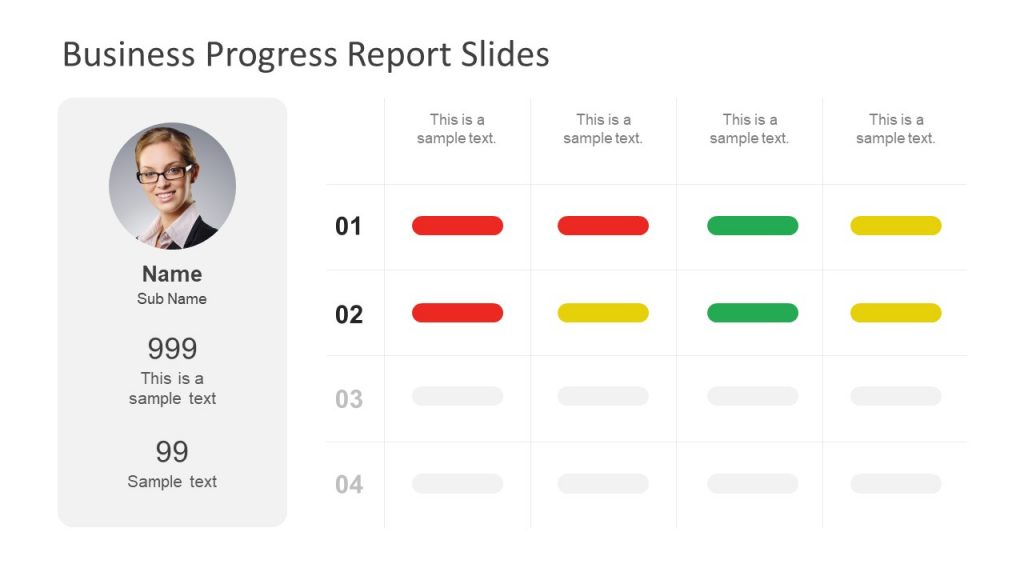
This Business Progress Report Slides PowerPoint template offers a clean, visual layout ideal for tracking multi-stage progress across projects or team members. Each row allows comparison using traffic light indicators (red, yellow, green), making it perfect for progress report presentations that need to show task completion, risk levels, or performance metrics at a glance. Add names, scores, and brief summaries on the left to personalize reports for team reviews, client updates, or weekly progress reports in executive meetings.
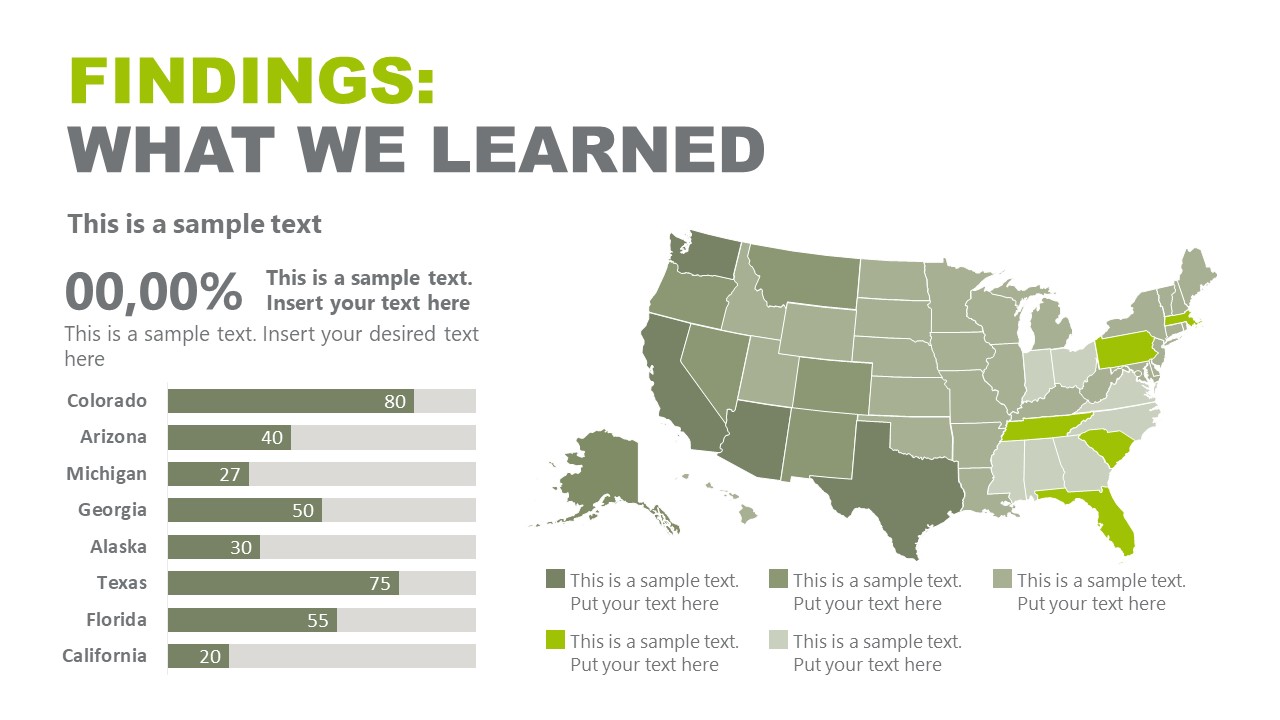
2. Progress Report Infographics PowerPoint Template
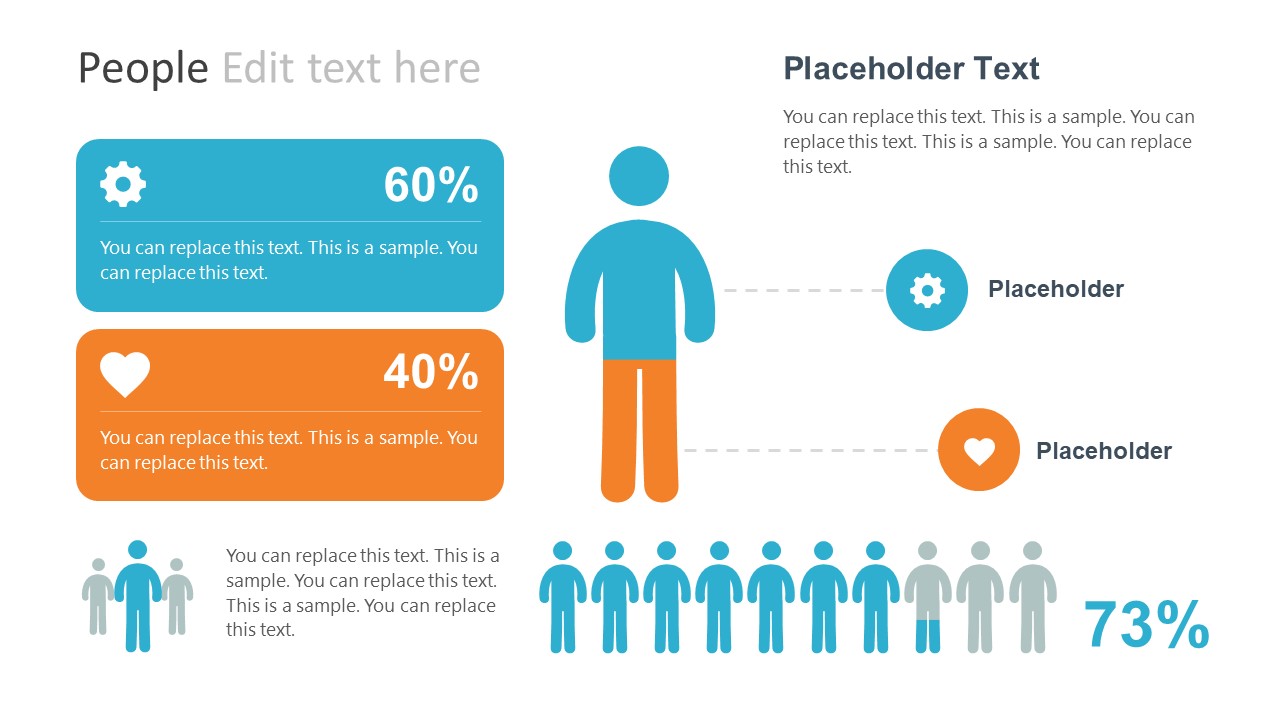
Our Progress Report PowerPoint Infographics template is ideal for presenting structured business insights with visual clarity. It includes timelines, pie charts, maps, and data-driven diagrams, making it suitable for communicating project updates, results, and performance trends.
Use it to support a progress report presentation by translating raw data into engaging visuals. The customizable placeholders enable you to align the content with project phases, KPIs, or regional breakdowns, instrumental in executive summaries or stakeholder briefings that require impactful storytelling through visuals.
3. Consulting Progress Report PowerPoint Template
This Consulting Progress Report PowerPoint Template is tailored for data-driven presentations where strategic insights and recommendations are key. With slides covering agenda, research approach, findings, and options, it’s well-suited for executive briefings, client updates, or detailed progress report presentations in a consulting context.
The layout emphasizes clarity through the use of charts, infographics, and maps, enabling you to communicate trends, gaps, and proposed solutions visually. Ideal for projects involving extensive analysis, this template supports clear storytelling while maintaining a formal and professional visual identity.
4. Business Progress Report PowerPoint Template
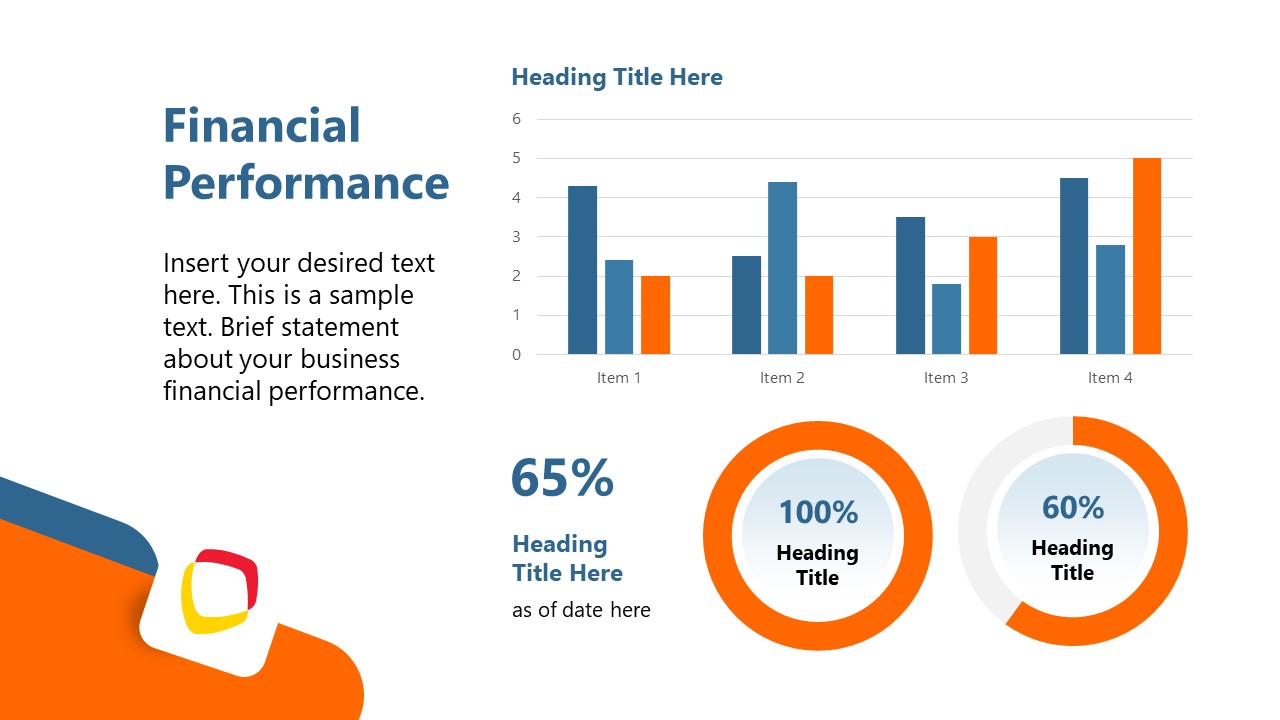
Work your way to create a stellar presentation using our Business Progress Report PowerPoint Template. Designed for transparent, professional reporting across corporate settings. It includes preformatted slides for executive summaries, financial performance, market analysis, risks, and recommendations, making it ideal for delivering structured progress report presentations.
The layout strikes a balance between visuals and concise text, enabling the effective communication of project milestones, business updates, and operational reviews. Its clean design and modern color scheme support both internal reporting and client-facing reviews, helping teams present insights with confidence and visual consistency throughout the presentation.
5. Quarterly Progress Report PowerPoint Template
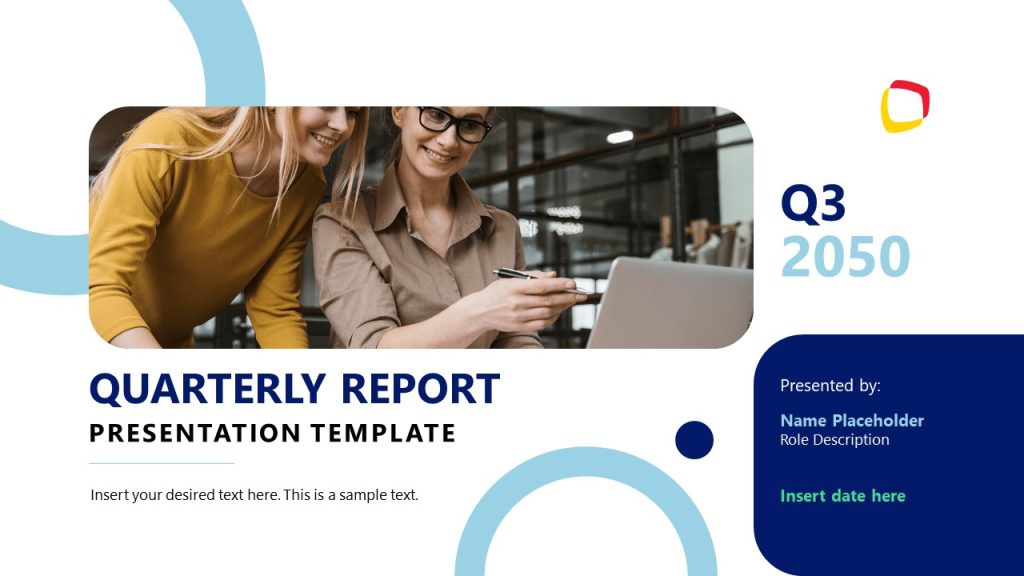
This Quarterly Progress Report Presentation Template is designed for structured business reporting over a three-month period. With sections for executive summaries, financial and operational performance, market analysis, and forward-looking guidance, it’s ideal for delivering a project progress report to stakeholders, leadership, or clients.
Packed with charts and visual indicators to highlight achievements, risks, and metrics. It also supports Q&A and contact follow-ups, making it suitable for high-level progress report presentations where strategic direction and measurable outcomes need to be communicated.
FAQs
What are the best slide types to include in a project progress report presentation?
Use timeline slides for task tracking, Gantt charts for scheduling, bar graphs for progress metrics, and bullet-free summary slides for key insights. A visual hierarchy helps stakeholders quickly grasp the status.
What’s the ideal length for a business progress report presentation?
A typical progress report presentation should consist of 10–15 slides and last no more than 15–20 minutes to deliver. Leave additional time for discussion or stakeholder questions.
How can I design a daily progress report presentation that doesn’t overwhelm the audience?
Limit content to essential updates: tasks completed, blockers, and immediate plans. Use icons, simple progress bars, and one slide per work area or team to maintain a quick and focused flow.
What colors should I use in a progress report presentation to clearly represent status?
Use traffic-light logic: green for completed/on track, yellow for delayed or at risk, and red for blocked or behind schedule. Make sure to label all color-coded elements for accessibility.
Should I include financial metrics in a progress report presentation design?
If your audience includes managers or executives, yes. Present budgets, spend-to-date, or cost overruns using bar charts, pie graphs, or comparison tables that are easy to interpret at a glance.
How do I handle sensitive project delays in a progress report presentation?
Be transparent but solution-oriented. Use neutral visual cues, such as muted colors, and pair delay data with your mitigation plan. Highlight root causes and action steps instead of placing blame.
What’s the best way to keep a progress report presentation engaging for remote teams?
Incorporate visuals, limit text, use animations sparingly, and narrate your slides with energy. Share the deck in advance and invite discussion with live polls or embedded questions to keep attention focused.
What mistakes should I avoid in a progress report presentation design?
Avoid cluttered slides, inconsistent fonts or colors, and dense text blocks. Don’t rely solely on visuals; your narration should add context. Also, avoid skipping over issues without addressing them.
How do I end a progress report presentation effectively?
Conclude with a summary slide showing current status (e.g., red/yellow/green), next actions, and any decisions or feedback required from the audience. A “Next Steps” slide helps maintain project momentum.
Can I turn a written progress report into a presentation?
Yes. Extract key sections, objectives, work done, blockers, and next steps, and reformat them using visuals and short summaries. Use slides to emphasize trends, comparisons, or forecasts.
Final Words
Ultimately, a progress report is not a formality; it is a leadership tool. Whether it’s a daily progress report capturing quick wins, a weekly progress report tracking iterations, or a monthly progress report used in board meetings, each format carries value when done right.
To succeed, remember that writing and presenting a project progress report is not about checking a box. It’s about creating alignment, fostering accountability, and driving decisions. Knowing how to do a progress report well means choosing the right cadence, selecting the proper tone, and backing up claims with data and analysis. It means understanding your audience and presenting with confidence. When those elements align, your report of progress becomes not just informative but transformative.