During a speech or presentation, information is conveyed orally. When relying solely on spoken words, a speaker may confuse and make it difficult for listeners to remember key facts. Therefore, combining presentation aids with oral explanations can improve the audience’s understanding and help them retain the main points.
This article defines what presentation aids are, their uses, different types of presentation aids, and their advantages and disadvantages.
Table of Contents
- What is a Presentation Aid?
- Are Presentation Aids the Same as Visual Aids?
- Why Should we use Presentation Aids?
- When Should Presentation Aids be Used When Delivering a Presentation?
- Types of Presentation Aids
- Recommended PPT & Google Slides Templates for Presentation Aids
- References
What is a Presentation Aid?
According to Leon, presentation aid refers to the tools and materials used by a speaker beyond spoken words to enhance the communicated message to the audience [1]. These presentation visual aids comprise templates, multimedia, and other visual elements to improve engagement and clarity. Presentation aids act as a bridge between the speaker and the audience, facilitating a presentation.
For instance, the strategic use of presentation templates and multimedia elements can elevate a presentation from a mere speech to a compelling narrative. Integrating these aids is rooted in established practices, ensuring a comprehensive and impactful message delivery. The proper use of presentation aids can improve the quality of the presentation.
Are Presentation Aids the Same as Visual Aids?
No, presentation aids differ from visual aids. Visual aid is also a type of presentation aid mainly used by speakers [1]. Examples of visual aids include images, tables, maps, charts, and graphs. In contrast, presentation aid is a broader category, including templates, 3D models, transitions, audio clips, and multimedia elements. The use of presentation aids goes beyond visuals, offering a diverse set of resources to enhance engagement and communication effectiveness [2].
Why Should we use Presentation Aids?
Presentation Aids are used for specific purposes in a presentation. To enhance audience understanding and retention can be one of the primary purposes. In addition, presentation aids guide transitions so the audience may remain focused [1]. For instance, charts and maps allow speakers to communicate complex information quickly.
Templates and multimedia elements advance the professionalism of a presentation. At the same time, using slideshows clarifies a presentation’s organization In short, a presentation aid ensures a lasting impact on the audience [3].
When Should Presentation Aids be Used When Delivering a Presentation?
Presentation aids must be used when a speaker wants to emphasize critical points or evoke an emotional response from the audience. Integrate presentation aids when conveying a complex concept. The strategic use of presentation aids, in line with speech, complements spoken words without overshadowing them. Whether visualizing data or incorporating multimedia elements, presentation aids are most effective when seamlessly integrated into a presentation.
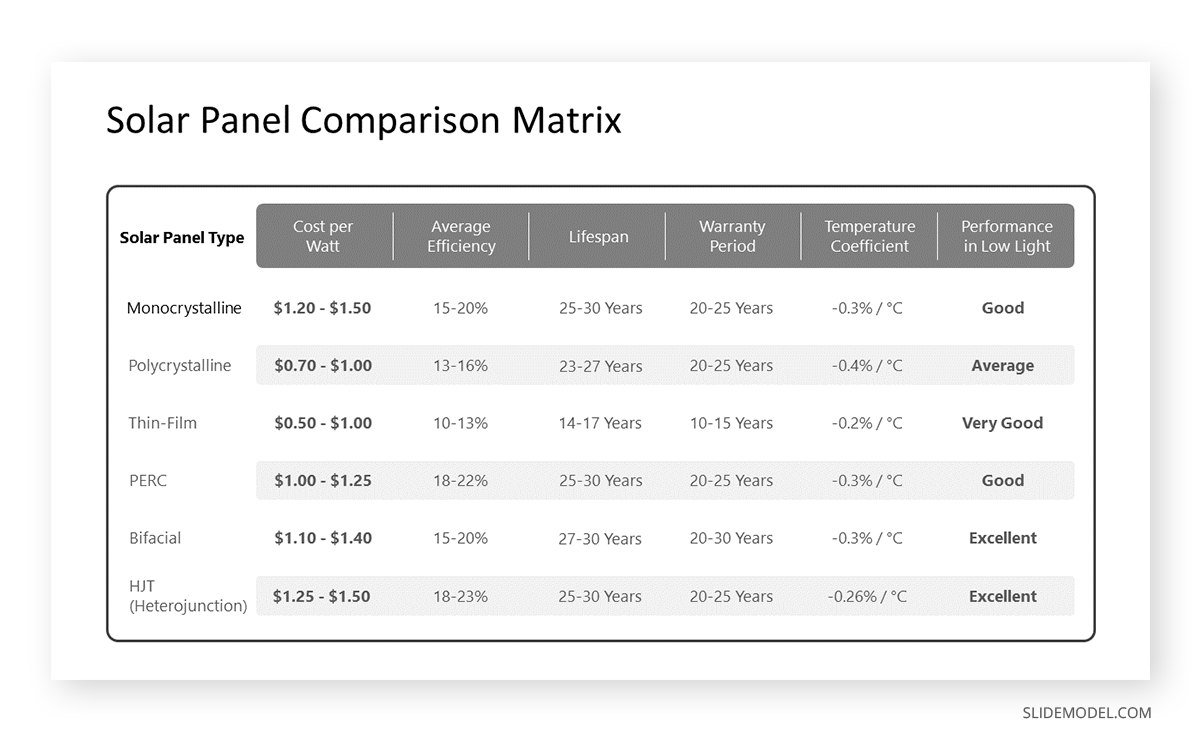
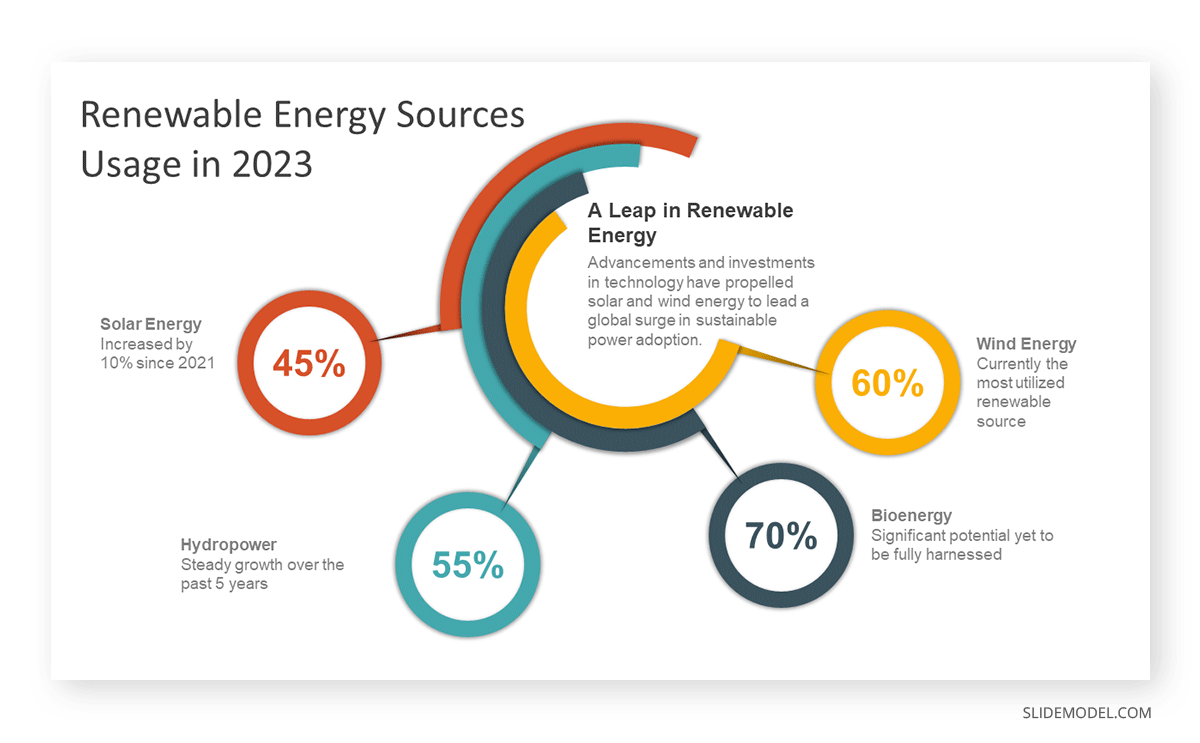
Therefore, presentation aids must be used when the speaker is presenting a specific idea relevant to an aid [4]. Consider a scenario where a speaker delivers a presentation on renewable energy sources. If one of the key points involves the efficiency of solar panels. He can use, for example, a graph or chart illustrating the comparative efficiency rates of various types of solar panels and contrast that with their average lifespan.
Types of Presentation Aids
Some types of presentation aids can be used in various presentations to assist the speaker. Highlighted advantages and disadvantages of various presentation aids allow presenters to use these presentational aids best. Here are some visual aid ideas for presentations and their advantages.
Slideshows
When considering visual aids for a presentation, one immediately thinks of a slideshow. Slide presentation software, such as PowerPoint, Prezi, and Google Slide, is commonly used by speakers. A slideshow presentation consists of slides containing words, images, or a blend of both, serving as a primary presentation aid [1]. Slide and slide-show design has a greater impact on the effectiveness of conveying a message to the audience.
PowerPoint and similar slideware offer easily editable templates for a consistent slide show appearance. These PowerPoint templates provide a structured framework reorganizing the design process and ensuring a consistent visual identity. Templates are easy to use and helpful for a consistent slideshow.
When using slide templates, a presenter needs to place images or graphs according to the message, medium, and audience. Each slide reinforces the key message, so a conscious decision about each element and concept is essential [5].
Place one idea or concept per slide to keep it simple and understandable. Do not overcrowd it with images or text. However, slideshows limit the audience’s participation which may cause boredom or confusion among the audience. At the same time, the strict order of slides bounds the presenter. He won’t be able to explain the topic openly [6]. Therefore, a presenter should be aware of the background and needs of the audience. By blending different flexible techniques, a presenter can elaborate his slideware presentation.
Charts and Graphs
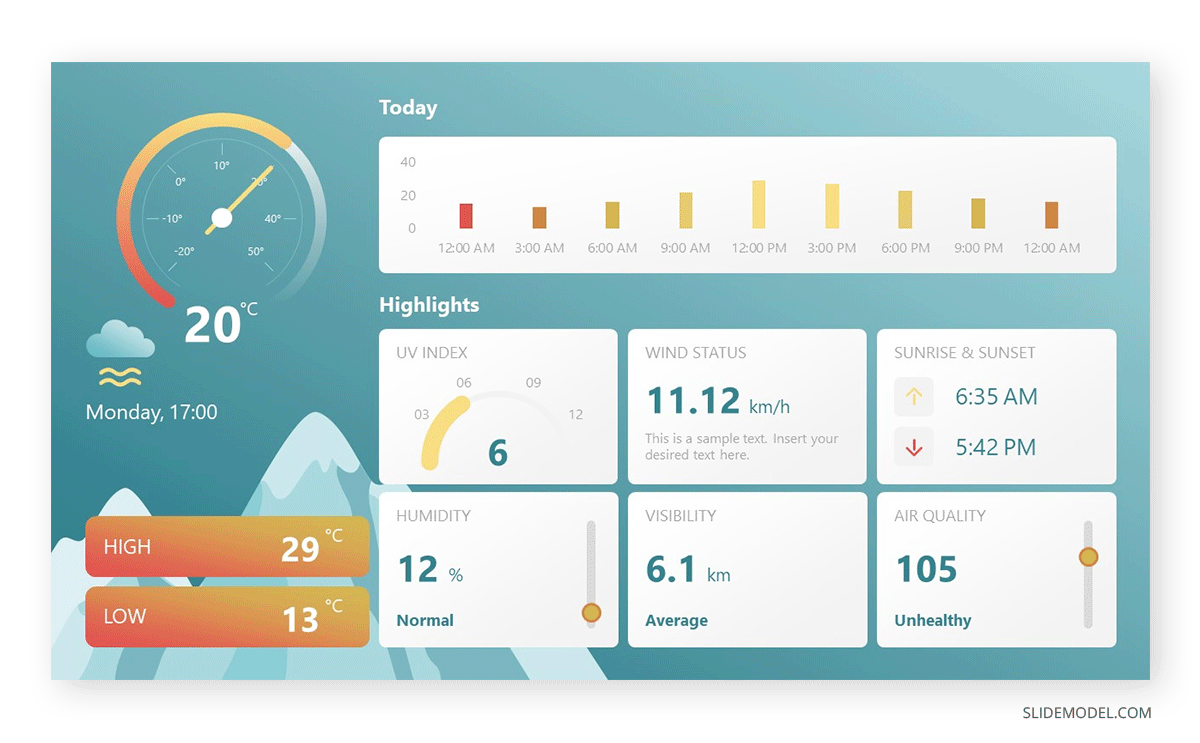
Graphs and charts are essential for precise data visualization. They simplify complex information for clearer communication. In business presentations, where data-driven decisions are paramount, these visual aid ideas for presentations offer advantages in conveying key insights concisely.
Graphs and charts extract complex numerical data into accessible formats and provide precision in representation. These are used to present trends, comparisons, and relationships, particularly in contexts requiring nuanced data analysis. Different charts have distinct purposes. Choosing the one that aligns with your data is essential to ensure clarity [3]. Pie charts, for instance, depict the relationship between parts and the whole. It is ideal to present up to eight visually distinct segments. A line graph effectively illustrates trends over time, while a bar chart facilitates direct comparisons between variables [3].
When creating charts, use different colors and provide clear labels. Maintain consistency in both colors and data groupings. For clarity, refrain from using 3-D graphs and charts. Minimize background noise, such as lines and shading [7]. Ensure that all elements of your graph are distinguishable from the background color. Remove unnecessary clutter. Keep graphs straightforward. Prioritize clarity in conveying your message and visually emphasize the intended conclusion for the audience [7].
Using graphs and charts can be challenging regarding effectiveness and ethics. Therefore, a solid grasp of statistical concepts is essential, and the chosen graphs should clearly represent quantities [3].
Align visual presentation aids to the audience and topic for optimal impact. In business scenarios, the ability to convey data insights efficiently improves decision-making processes. Beyond representation, graphs, and charts enhance audience understanding [2]. Visual learners benefit from the graphical depiction of information. The choice of graph or chart type should align with the audience’s familiarity with the subject matter.
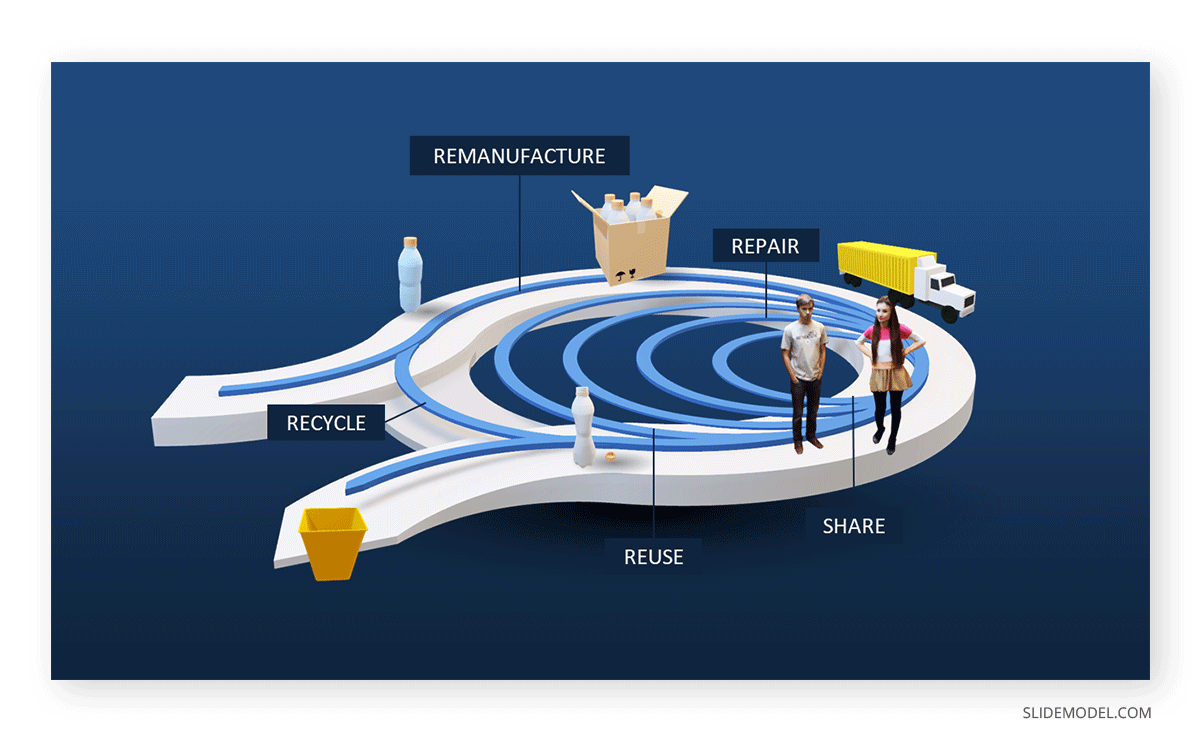
3D Modeling
3D modeling implies creating realistic or abstract representations of objects, fictional characters, environments, or concepts through digital tools [9]. 3D modeling enhances visualization, making complex concepts more accessible. It is mainly used in the Engineering and Architectural fields. It improves audience understanding and visual engagement. Presenters can use this technique to provide a clearer understanding of intricate details. It allows the audience to visualize the inner workings of machinery, architectural designs, or scientific processes [8]. The dynamic nature of three-dimensional visuals captures and sustains the audience’s attention. This engagement is particularly beneficial in holding the audience’s interest throughout the presentation and prevents attention fatigue. However, presenters should be cautious to avoid visual overload. Ensure that the 3D elements enhance rather than distract from the main message.
Creating a 3D model for a presentation requires basic skills and knowledge of 3D modeling techniques. It includes modeling, texturing, lighting, and rendering [9]. Modeling involves shaping and structuring 3D models. Texturing applies color, pattern, or material using images or shaders. Lighting incorporates light sources and shadows to build the desired mood or atmosphere. However, for basic 3D models, a presenter can use PowerPoint to create or access available designs from online sources.
Moreover, these models enhance communication by creating animations, simulations, or demonstrations for understanding a point or process. The versatility of 3D models allows for generating various views, angles, or perspectives of a subject, facilitating customization based on audience or purpose.
Maps
Maps are highly valuable to use when information is clear and concise [3]. Different types of maps include population, geographical, political, climate, and economic maps [3]. Therefore, select the one that aligns with the presentation. Choose a map that highlights the specific information the speaker intends to convey. If a speech necessitates geographic reference, a map is an effective tool [7].
Maps provide precise visual communication of geographical data and help convey spatial relationships effectively.
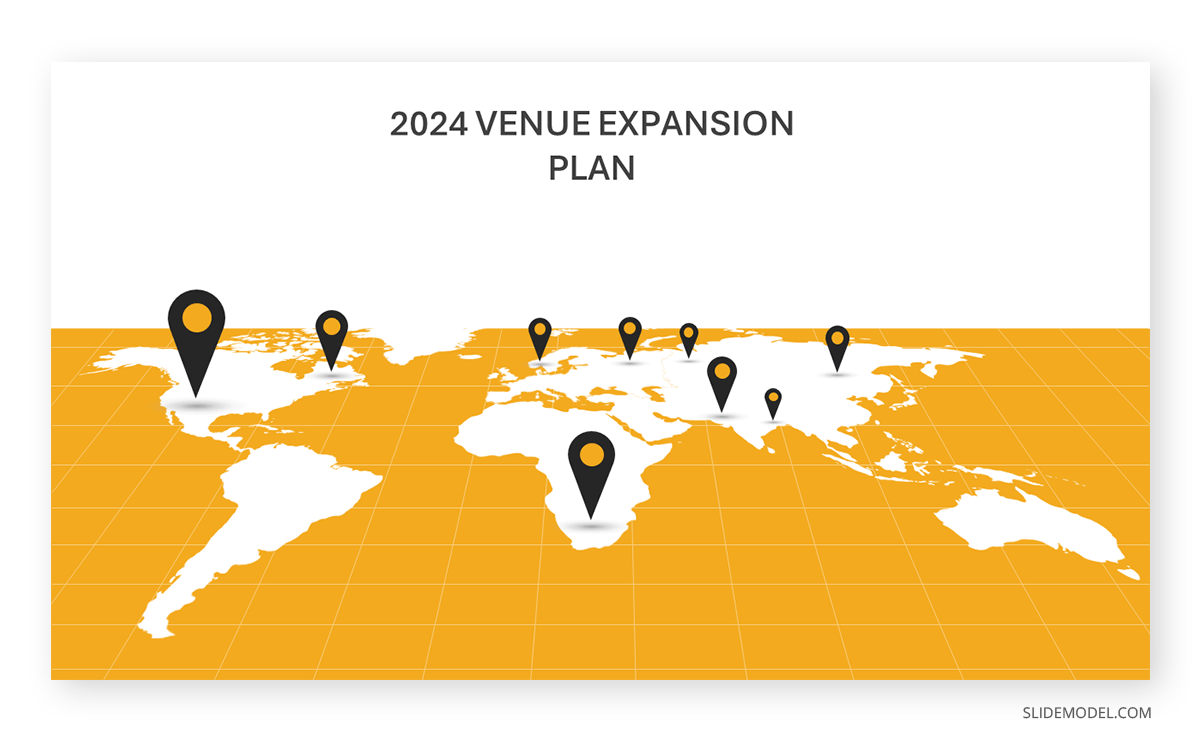
Maps communicate information with clarity [7]. They are used to present global market trends, regional analyses, or any scenario where location-based insights matter. For instance, a world map can highlight key regions of interest when presenting global market trends. It helps the audience grasp the distribution of market opportunities.
The visual appeal of maps enhances audience engagement, particularly when presenting data tied to specific locations [10]. For a marketing presentation, a map showcasing the distribution of target demographics can capture attention and reinforce the spatial context of the campaign.
However, overly complex maps can confuse the audience. Similarly, relying on maps for all data types can lead to oversimplification.
Dry-Erase Board
The Dry-Erase Board is useful for brainstorming and note-taking. It is one of the ideal presentation materials for spontaneous discussions and audience engagement. It allows the presenter to make live diagrams and emphasize key points. At the same time, it is cost-effective and user-friendly.
Suppose a presenter chooses a dry-erase board. He needs to ensure that the board is presentable, rehearsed, and clear [7]. There are a few rules to remember before using a Dry-Erase Board as a presentation aid [3]. First, ensure legible writing is large enough for everyone to see. Use clear printing instead of cursive script. Use short phrases rather than complete sentences. Avoid turning away from the audience while speaking. Use markers that are functional and clean the board afterward.
The drawback of the Dry-Erase Board is that it has limited visibility in large settings. When using a Dry-Erase board, a presenter may seem less prepared. However, many speakers effectively use these boards for interactive elements in their speeches [3]. It is great for dynamic presentations, but space and audience size should be considered.
Brochures and Handouts
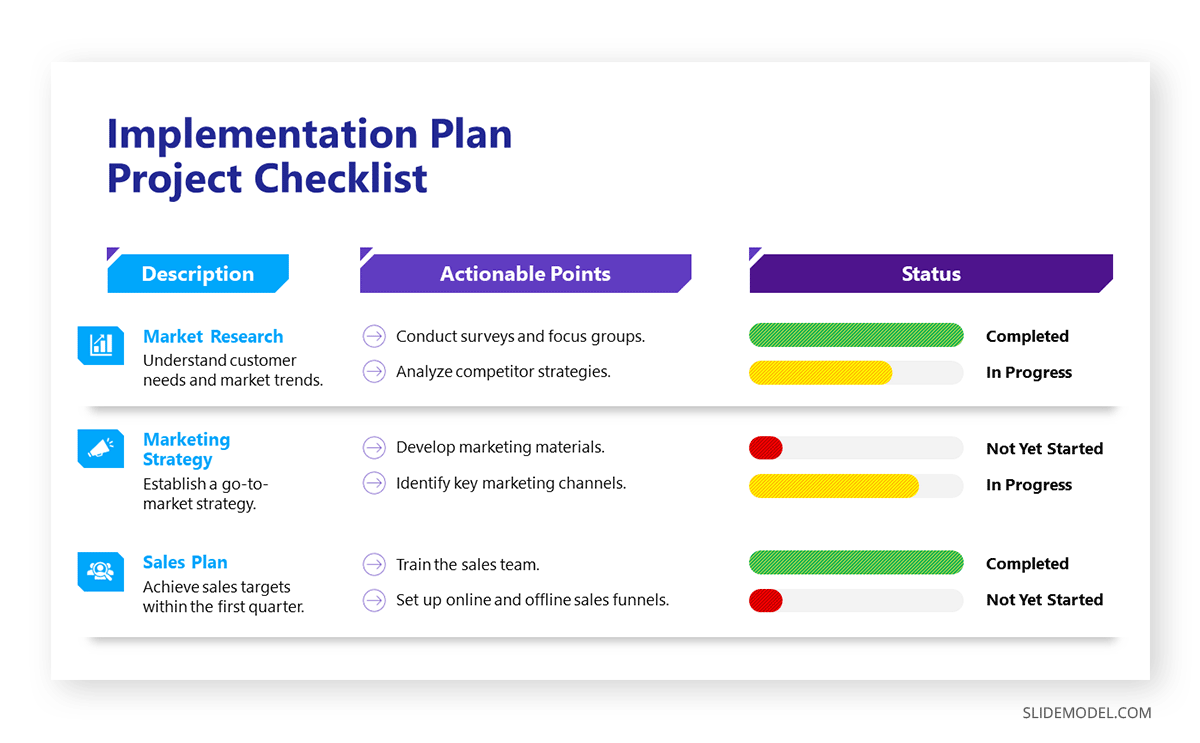
Brochures and handouts are tangible takeaways for the audience. They enhance information retention and serve as lasting references [11]. These presentation materials are effective in educational presentations or seminars, offering supplementary details for in-depth understanding.
There are a few things to consider when distributing handouts to the audience [7]. Provide a handout for each audience member, avoiding the need for sharing. Never distribute a single copy to pass around, as it detracts from a professional image. Handouts should be distributed before, during, or after the presentation. If audience participation is required, distribute handouts before starting or have a volunteer distribute them. Include only essential information, organized for clarity. If the handout is meant for audience follow-along, inform them of this and mention specific references during the speech [7].
Check our article about how to create handouts for a presentation.
However, potential disadvantages include the timing of distribution. Handing out materials at the wrong moment can distract the audience.
Audio Clips
Using an audio clip in a presentation introduces an auditory dimension. It evokes emotions and enhances the overall experience.
When using an audio clip, select a clip of appropriate length for your speech duration. Prior to speaking, familiarize yourself with audio or video equipment to avoid disruptions and maintain credibility. Ensure computer speakers are on and set to the right level of volume level [7].
However, potential disadvantages of audio include technical issues with sound playback. It requires presenters to ensure seamless integration. Besides, overuse of audio clips can also be overwhelming, requiring careful selection and timing.
Videos
Integrating prerecorded videos offers a dynamic means of presenting information, catering to visual learners, and capturing audience attention. Prepare short videos from platforms like YouTube or Vimeo, song segments, or podcasts before your speech [7]. Cue the clip to the right spot and ensure the browser window is open. Before playing the clip, Provide the audience with context about its relevance to the speech. Explain its connection and significance. Ensure the video enhances the message without duplicating information already conveyed [3].
A video demonstration of a complex process can significantly enhance understanding in a training session. However, presenters should be mindful of timing and integration to avoid disruptions. Technical issues during playback can also pose challenges. It requires thorough testing beforehand.
Recommended PPT & Google Slides Templates for Presentation Aids
1. Price Corridor of the Target Mass Presentation Aid Template
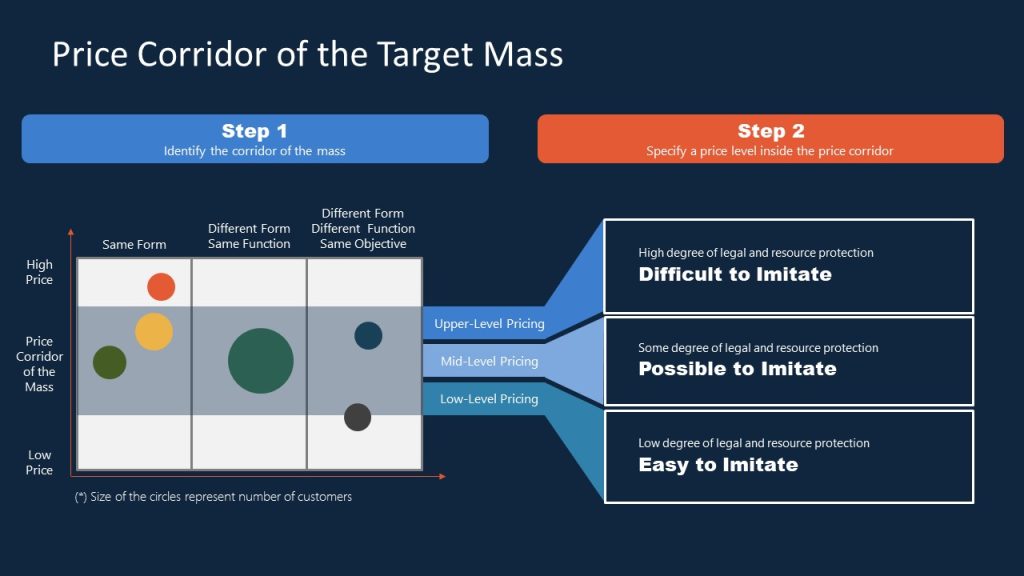
For presenters looking to implement the Blue Ocean Strategy in their organization, this presentation aid material gives emphasis on the potential pricing tiers and the difficulty of adapting that solution. Ideal for sales teams looking to innovate their pricing strategy.
2. Innovation Strategy Diagram Presentation Aid Material Template
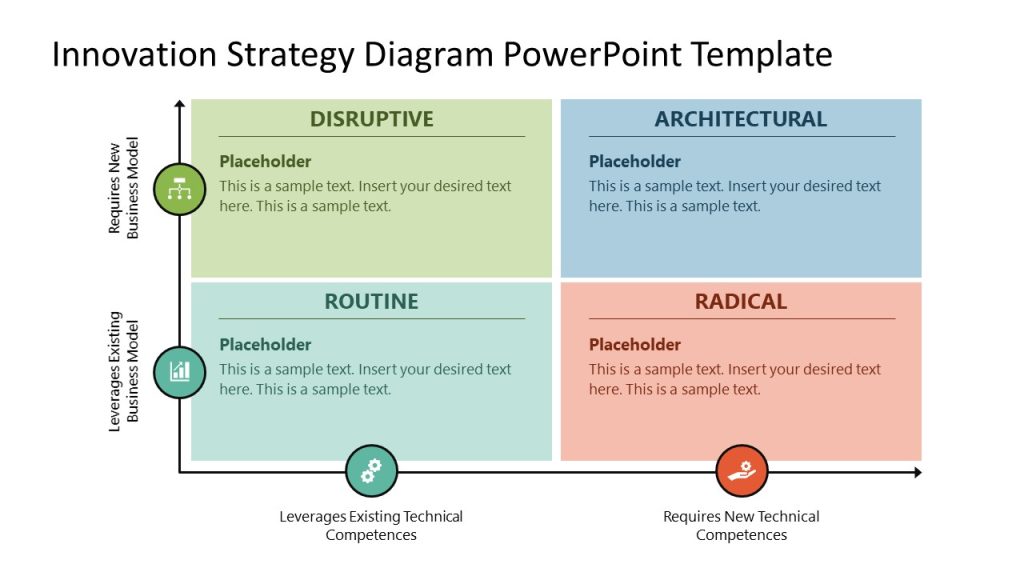
Professionals seeking to introduce new strategy models can benefit from this highly visual strategy diagram template for PowerPoint & Google Slides. By using this matrix PPT slide, we can compare approaches and leverage them regarding the effort required for their implementation.
3. AIDAL Model Funnel Sales Presentation Aid
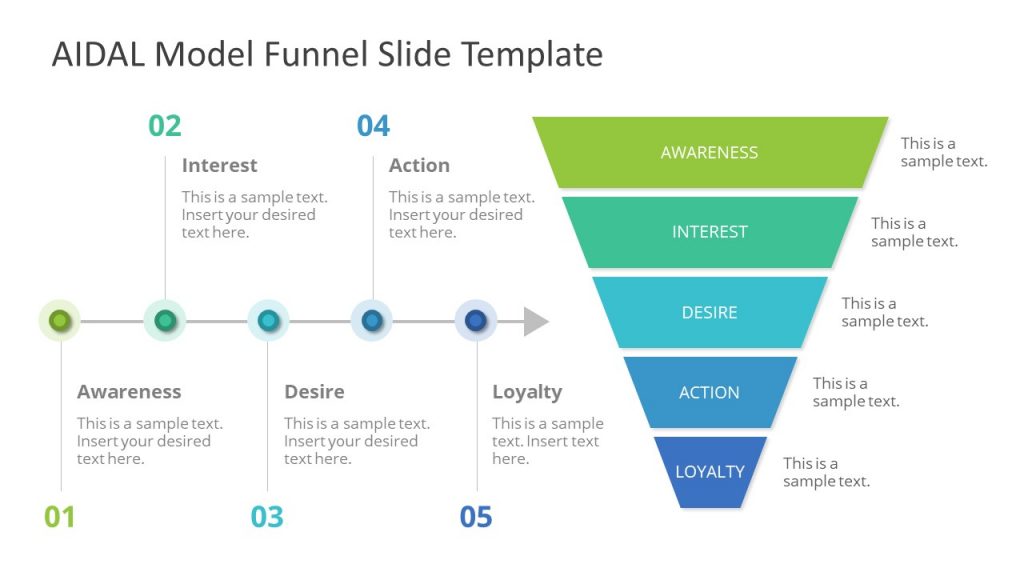
Whether your project requires brand awareness analysis or the steps that lead to customer loyalty, this funnel diagram for PowerPoint & Google Slides based on the AIDAL model is the ideal resource for your presentation. We can go stage by stage on the customer buyer journey, expanding details on the horizontal timeline shown right next to it.
4. Opportunities Solution Tree Template Presentation Aid for Product Development
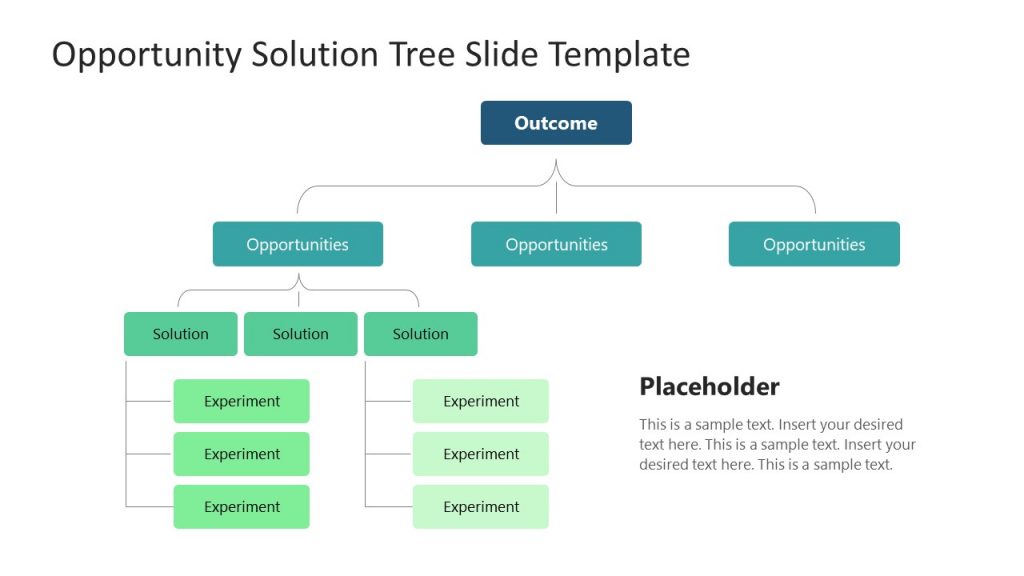
Showcase your product discovery process by using our Opportunities Solution Tree PPT template. With this tree diagram presentation aid, we can easily arrange the customer pain points and streamline ideas that offer solutions to those emerging opportunities.
5. Business Brochure Aid for Presentation Handouts
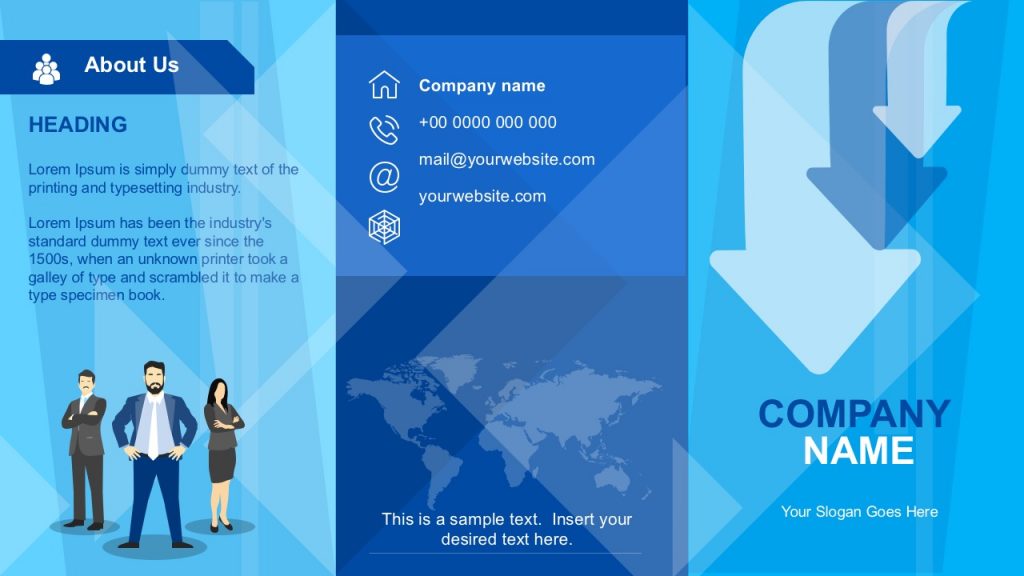
Say goodbye to boring presentation handouts with this business-tailored brochure template for PowerPoint and Google Slides. In a two-sided format, companies can add relevant information about their activities, value proposals, and contact data.
6. Atlanta City Map and City Skyline Illustration Aids for Presentations

Among the multiple product offerings we have for map templates, we would like to highlight the particular style of this slide deck of Atlanta City. By accessing this product, you can get skyline silhouettes of Atlanta City, the Georgia State Capitol Building, maps in white and dark blue tones, bar charts, etc. They can be an ideal presentation aid example for users looking to deliver talks about local politics, new business venues, and more.
7. 3D Tetris Cube Visual Aid for a Presentation
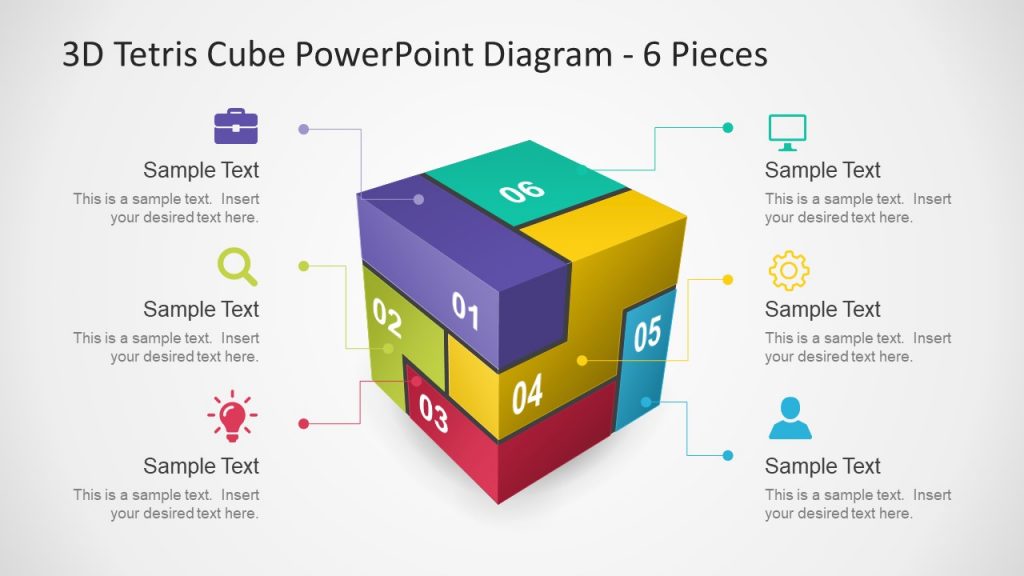
How many times have you looked to create a 3D model to express an idea or concept made of different components? If so, this template ranks among the best examples of a visual aid. It’s almost instant to edit, as you just need to change the content in placeholder text areas and the colors, and that’s it.
8. Sprint Retrospective Presentation Aid Template for PowerPoint & Google Slides
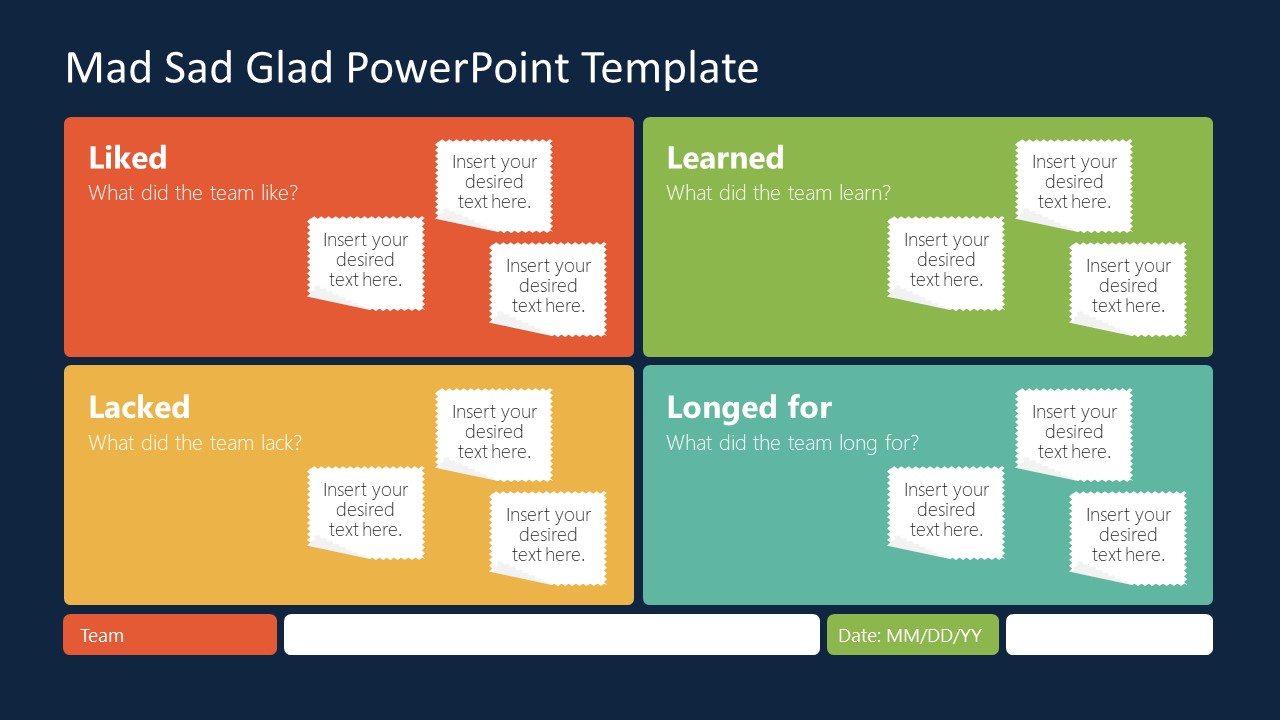
This Sprint board template is the answer to the lack of clarity during sprint retrospective meetings. Scrum Masters can discuss in detail the aspects of the project covering what was considered a good job during the sprint, what was missing, what the team learned, and which are the new goals to achieve.
Turn your Agile presentations into powerful tools for action with this visual presentation aid!
References
[1] Leon, M., 2023. Presentation Aids. Public Speaking as Performance. https://opentext.ku.edu/publicspeakingperformance/chapter/presentation-aids/
[2] Shier, M. 2020. 11.3 Presentation Aids. Student Success. https://opentextbc.ca/studentsuccess/chapter/presentation-aids/
[3] Mapes, M. 2019. Presentation AIDS. Speak Out Call in Public Speaking as Advocacy. https://opentext.ku.edu/speakupcallin/chapter/chapter-10-presentation-aids/
[4] Functions of Presentation Aids. 2016. Public Speaking. https://open.lib.umn.edu/publicspeaking/chapter/15-1-functions-of-presentation-aids/#:~:text=Presentation%20aids%20can%20help%20clarify,process%20is%20a%20complex%20one.
[5] Gruber, K. 2022. Chapter Fourteen – Presentation Aids, Principles of Public Speaking. https://mtsu.pressbooks.pub/principlesofpublicspeaking/chapter/chapter-fourteen-presentation-aids/
[6] Xingeng, D. and Jianxiang , L. 2012. Advantages and Disadvantages of PowerPoint in Lectures to ScienceStudents. I.J. Education and Management Engineering. MECS press. https://www.mecs-press.org/ijeme/ijeme-v2-n9/IJEME-V2-N9-10.pdf
[7] Goodman, Dr.L. and Amber Green, M.A. Presentation AIDS, Public Speaking. https://open.maricopa.edu/com225/chapter/need-presentation-aids/
[8] Vincenti, G. and Braman, J. 2011. Teaching through multi-user virtual environments: Applying dynamic elements to the modern classroom, Google Books. Available at: https://www.google.com.pk/books/edition/Teaching_through_Multi_User_Virtual_Envi/sekY2Iy5LdcC?hl=en&gbpv=1&dq=3d%2Bmodelling%2Bas%2Ba%2Bpresentation%2Baid&pg=PA389&printsec=frontcover (Accessed: 27 November 2023).
[9] Mamgain, P., 2020. Autodesk 3ds Max 2020: A Detailed Guide to Modeling, Texturing, Lighting, and Rendering. Padexi Academy.
[10] 15.1 Functions of Presentation Aids. 2016. Public Speaking. Available at: https://open.lib.umn.edu/publicspeaking/chapter/15-1-functions-of-presentation-aids/#:~:text=Presentation%20aids%20can%20help%20clarify,process%20is%20a%20complex%20one.
[11] Chapter 15 Presentation AIDS: Design and Usage. (https://saylordotorg.github.io/text_stand-up-speak-out-the-practice-and-ethics-of-public-speaking/s18-presentation-aids-design-and-u.html).