Whenever we speak about consulting presentations, several firm names come to mind: BCG, Bain, and PwC. However, McKinsey & Company stands out as the most well-known choice in quality standards due to its clear and concise approach to conveying information. This presentation structure and style are widely recognized in business and strategy presentations, allowing speakers to communicate complex information to senior executives.
In this article, we will dive into the key principles that build the McKinsey presentation structure, provide insights into how business professionals can implement similar methods to create effective and persuasive presentations, and offer some visual examples of McKinsey presentation slides.
Table of Contents
- What is the McKinsey Presentation Style?
- Benefits of McKinsey Presentation Slides
- Understanding the Structural Components of a McKinsey Presentation
- The Importance of Storyline
- Title Slide
- Executive Summary
- The Anatomy of a McKinsey’s Deck Body Slides
- Conclusion Slides
- Recommended PPT Templates for McKinsey Styled Presentations
- Final Words
What is the McKinsey Presentation Style?
The McKinsey presentation style emerged from the need to communicate complex strategic insights efficiently to senior executives, often under tight time constraints. Founded in 1926, McKinsey & Company has been at the forefront of strategic consulting, advising businesses, governments, and institutions worldwide. The firm’s reputation for delivering insightful analyses and actionable recommendations is partly attributed to its distinctive presentation style.
The style is not just about aesthetics; it’s a philosophy of communication that emphasizes structured thinking, logical coherence, and persuasive storytelling. It combines rigorous analysis with clear messaging to drive decision-making.
Core Principles of the McKinsey Presentation Style
McKinsey presentation slides are built upon several foundational principles:
- The Pyramid Principle: A top-down approach where the main conclusion is presented first, followed by supporting arguments and detailed evidence.
- The MECE Framework: Ensuring that all information is Mutually Exclusive and Collectively Exhaustive, avoiding overlaps and gaps.
- Data-Driven Insights: Basing all recommendations and conclusions on solid data and rigorous analysis.
- Minimalist and Consistent Design: Utilizing clean, uncluttered slides with a consistent visual theme to enhance readability and focus.
- Logical Flow and Coherent Narrative: Structuring the presentation to guide the audience seamlessly through the argument.
- Audience-Centric Approach: Tailoring the content and delivery to the specific needs and expectations of the audience.
Benefits of McKinsey Presentation Slides
By implementing McKinsey slides into the presentation design workflow, presenters can structure the content to boost clarity and understanding. This presentation structure is aimed to present the main conclusion upfront, structuring the supporting information in a logical flow. As a result, the audience can easily grasp complex ideas, thus reducing the cognitive load, which is a tiresome factor in lengthy presentations, and also helping to retain attention.
Another point to highlight is that the nature of McKinsey PowerPoint presentations grounded in data and logical reasoning is inherently more persuasive. Data backs any kind of statement, reducing the skepticism, and – depending on the type of data used – an emotional factor can be added to enhance the narrative flow. Hence, presenters end up delivering robust cases that can even anticipate counterarguments.
Finally, we can say that the consistent formatting and minimalistic design that most McKinsey presentation PPTs bear allow the speaker to reflect a high level of professionalism. The polished aesthetics of the slides enhance the organization’s reputation while making the audience more receptive to its message.
If we have to singularize three main benefits of the McKinsey consulting decks, these would be:
- Evidence-based arguments
- Simplified complexity
- Efficiency
Understanding the Structural Components of a McKinsey Presentation
Before creating a slide in the McKinsey style, we need to understand each of the components that structure this kind of consultancy slide deck.
The Pyramid Principle
Developed by Barbara Minto, a former McKinsey consultant, the Pyramid Principle is a method of structuring communication. The idea is to begin with the top-level message, which is your main conclusion or recommendation for the audience. After that, present the supporting arguments for your conclusion, which should be grouped logically. Each point has to be backed up with data, analyses, and examples that substantiate each supporting argument.
Let’s put this example.
Conclusion: The company needs to invest in renewable energy technology
Supporting Arguments:
- Market Growth: The renewable energy sector has rapidly expanded in the past decade.
- Regulatory Incentives: Governments offer subsidies and tax breaks to organizations that opt for renewable energy.
- Corporate Responsibility: Aligning with sustainability goals enhances brand image.
Evidence:
- For Market Growth, present statistics on industry growth rates.
- For Regulatory Incentives, detail the specific policies and financial benefits while citing examples of competitors that opted for this route and their results.
- For Corporate Responsibility, cite consumer preference studies for your target buying personas.
Implementing the MECE Framework
Working under the MECE framework ensures that supporting arguments are organized effectively.
- Mutually Exclusive: Each point should be distinct without overlapping content.
- Collectively Exhaustive: All points together should cover the entire scope of the argument.
On this behalf, we can mention some ideas to help you structure your content based on our expertise:
- Categorize your content to avoid duplication. This can be done as easily as grouping similar ideas with their supportive data.
- Use the Gap Analysis to check for missing elements that are critical to the main argument.
- Apply hierarchy principles to organize points from most to least impactful.
Emphasis on Data-Driven Insights
In his book, Presentation Zen: Simple Ideas on Presentation Design and Delivery, Garr Reynolds discusses the role of data in supporting key messages and establishing the speaker’s credibility. McKinsey decks use quantitative and qualitative data to support their arguments. Quantitative evidence can be shaped through statistics, charts, graphs, etc., whereas qualitative insights imply expert opinions, case studies, and testimonials.
In our experience, it is best to only include data that directly supports your point rather than stuffing slides with unrequired information. Data should be presented in a clear format, which our article on data presentations can give you further information about. If the topic involves any format of data-driven decision-making, then work with presentation layouts like dashboards, which simplify the understanding of large datasets.
The Minimalist Aesthetic
As we’ll study below, McKinsey slide decks aim for simplicity. They avoid clutter, and in most cases, they limit text to focus on key points. In case large chunks of text cannot be avoided, they stick to a one-slide format for that requirement, using a contrasting color in the format of a banner or complementary graphic, but they don’t mix and match large amounts of data with charts or graphs. It is all about preserving the audience’s focus.
Consistency is a must across all slides. Use the same fonts, colors, and layouts throughout. Choose font sizes and styles (and please avoid script typefaces) that are easy to read from a distance.
McKinsey presentations use a limited set of colors aligned with their brand identity. Headings, subheadings, and bullet points have a clear visual hierarchy to guide the reader’s eye.
Use white space to separate elements and reduce visual fatigue. Be mindful of a strong contrast between the text and the background color of your slides.
The Importance of Storyline
At the heart of any McKinsey presentation lies a strong, coherent storyline. Consultants craft their presentations like a narrative, guiding the audience through complex information logically and engagingly.
The storyline addresses a central problem or question, with each slide serving as a stepping stone toward a recommendation or conclusion. This narrative structure is often built using consulting frameworks like SCR (Situation-Complication-Resolution), where the problem is clearly defined, complications are identified, and resolutions are proposed.
Why the Storyline Matters
Engagement: A clear storyline keeps the audience engaged by laying out a roadmap from the very beginning. McKinsey consultants use this structure to capture and retain attention, ensuring that each slide leads logically to the next.
Focus: Presentations without a defined narrative often lose focus. The storyline ensures that only the most relevant information is presented, avoiding unnecessary detours or tangents. By anchoring every piece of content to the overarching message, McKinsey consultants keep their presentations tight and purpose-driven.
Clarity: Complex topics can easily overwhelm an audience, but a structured narrative makes them more digestible. The storyline breaks down intricate problems into manageable parts, leading the audience step-by-step through the thought process. The clarity of the storyline ensures that the main points resonate clearly without confusion.
Decision-Making: In corporate environments, presentations are often intended to drive decisions. A strong storyline ensures the presentation builds logically towards a recommendation or solution. By following the storyline, decision-makers can see the rationale behind recommendations, which increases the likelihood of buy-in.
Memorability: A narrative approach makes the presentation more memorable. Instead of bombarding the audience with disconnected facts and figures, McKinsey’s presentations use the storyline to create a lasting impression. A straightforward narrative ensures that the key points and recommendations are retained long after the presentation ends.
Structuring the Storyline
When building a storyline for a presentation, the following elements are key.
- Introduction of the Problem: The storyline starts by framing the core issue. This sets the stage for the following analysis and gives the audience a reason to care about the presentation.
- Complication: After outlining the issue, the presentation identifies complications or challenges. This helps highlight the problem’s urgency and sets up the need for a solution.
- Resolution and Recommendations: Finally, the storyline leads to the solution or recommendation. This is the ultimate goal of the presentation—guiding the audience to a clear and actionable conclusion. Every slide leading up to this point should reinforce the credibility of the recommendations.
Multiple methods exist to structure a storyline. In general, we recommend you check these articles to learn how to use storytelling as a tool in presentations and how to start and end a presentation:
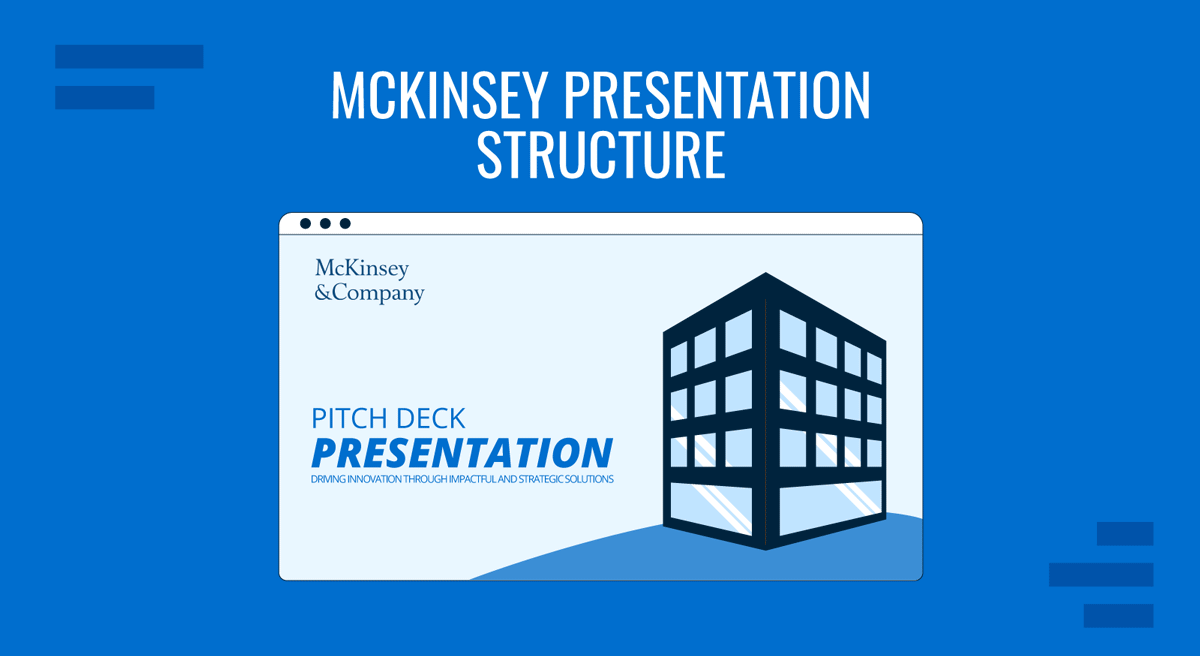
Title Slide
The title slide provides more than an introduction; it immediately sets expectations for the audience. In a corporate or consulting environment, presentations must quickly communicate what will be discussed and why it matters. By crafting a title that directly reflects the objective of the presentation, consultants can start guiding the audience from the very first slide.
In general, the title slide includes the presentation title, client name, date, and sometimes the consulting team’s names. The title itself is typically precise and straightforward, immediately signaling the purpose of the presentation. The clean design reflects McKinsey’s structured, no-frills approach in all its communication, focusing on clarity over aesthetic embellishments.
Key points to consider for a McKinsey presentation title slide:
- Ensure the title is concise and clearly states the presentation’s main focus.
- Use minimal design elements, focusing on clear lines, consistent fonts, and restrained use of color.
Executive Summary
After the title slide, the executive summary serves as a high-level overview of the entire presentation. This section is designed to answer the most important questions upfront, summarizing key findings, recommendations, and next steps straightforwardly. The goal is to ensure decision-makers can grasp the presentation’s core message in just a few minutes without diving into the following detailed slides.
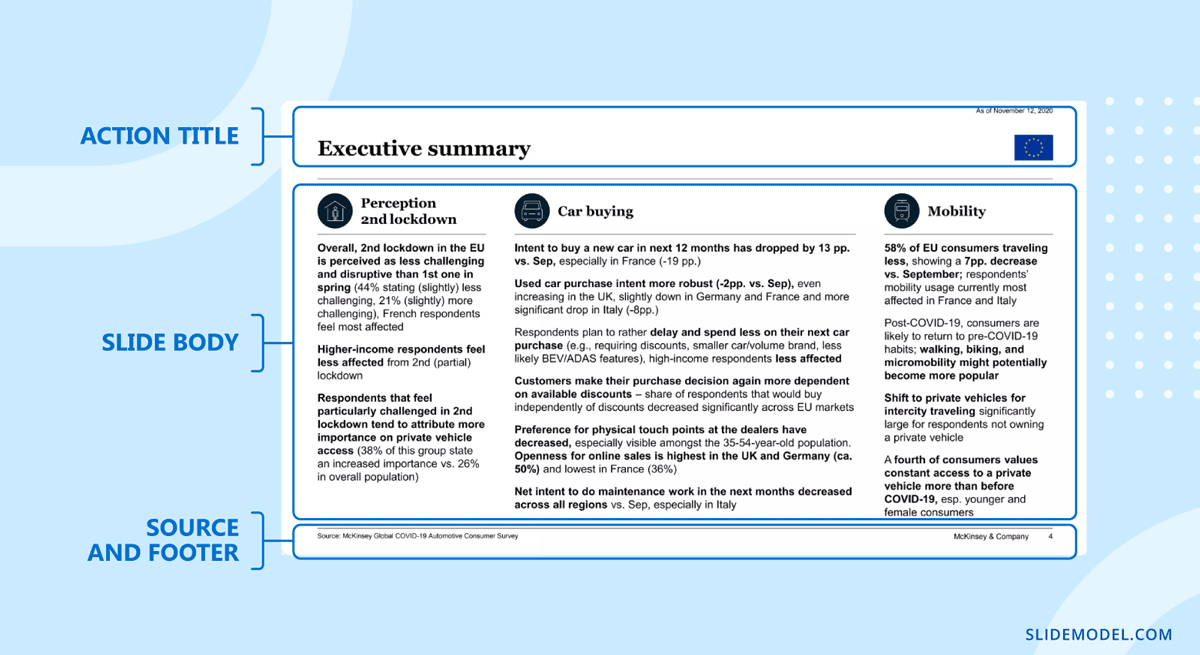
McKinsey’s executive summaries highlight the actionable recommendations right at the beginning. While brief, the executive summary still references the core data or evidence supporting the conclusions. However, it only includes the most critical pieces of information, with the detailed data presented later in the body slides.
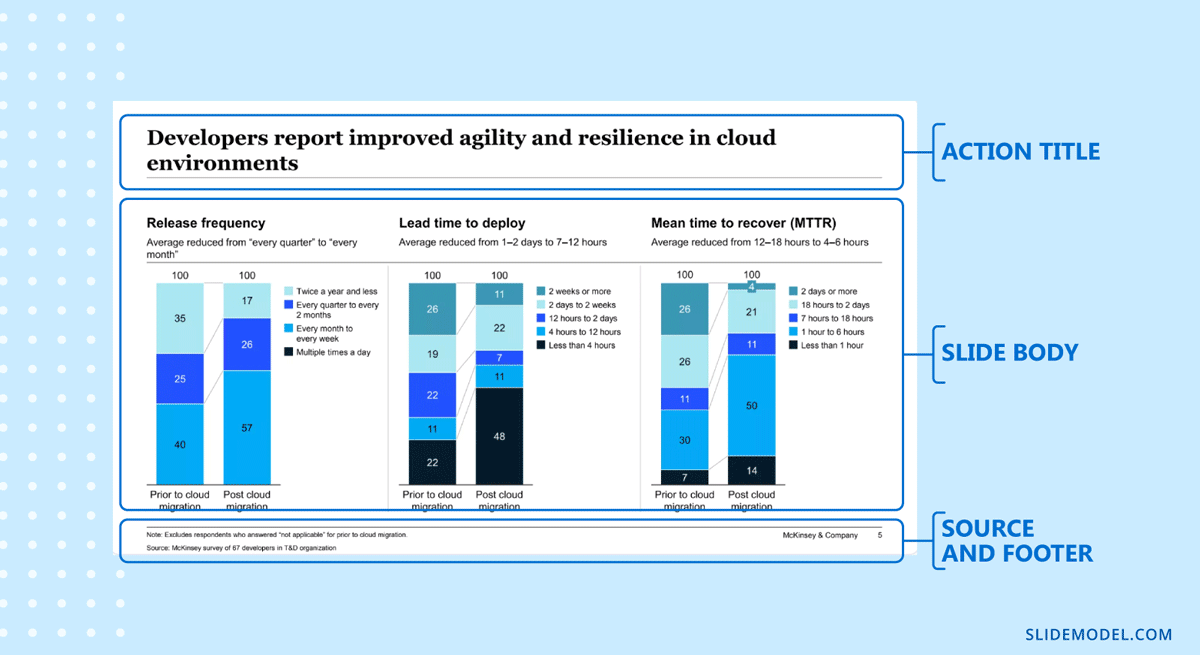
The Anatomy of a McKinsey’s Deck Body Slides
The anatomy of McKinsey body slides meticulously balances data presentation, visual clarity, and textual reinforcement. Each component plays a specific role in effectively delivering information. Regarding titles, every slide has a headline that captures the key message or takeaway. This title isn’t just a label—it tells the audience what they need to know from the slide.
Now, let’s see what the typical designs found in McKinsey slide examples can tell us.
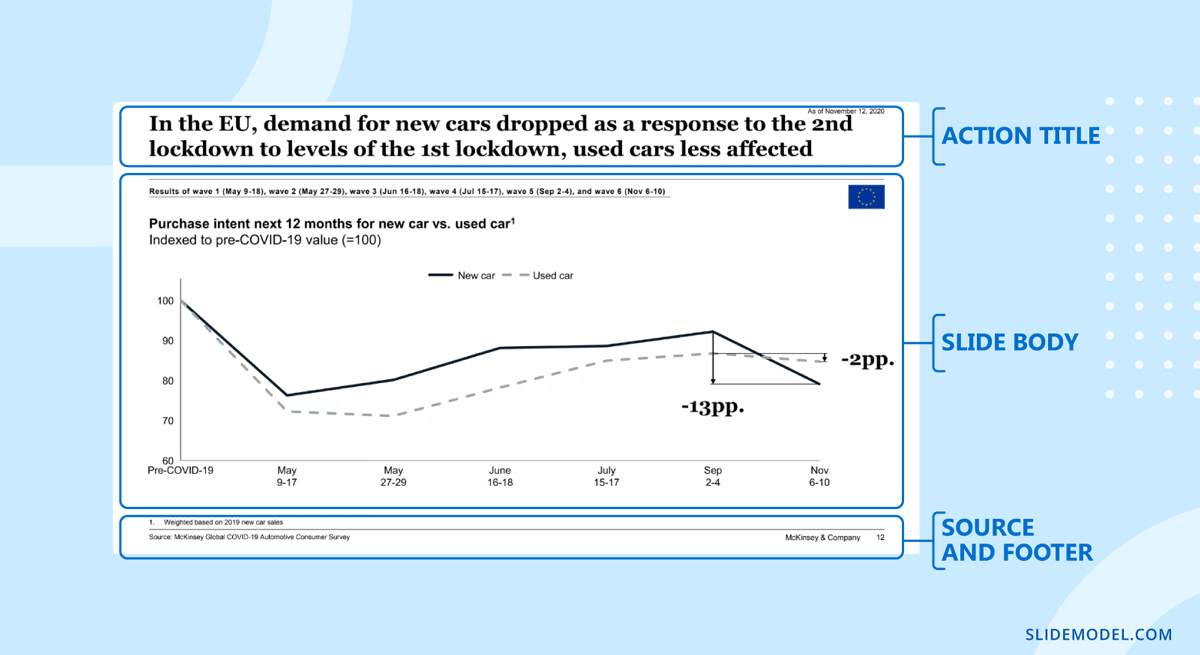
Full-Slide Graphs
Graphs and charts often cover an entire slide to give prominence to the data and avoid clutter. By dedicating a whole slide to one chart, McKinsey ensures that the audience can focus solely on the message the data conveys without distractions. These slides are clear, visually impactful, and often feature minimal or no additional text to keep attention on the data trend or insight.
Infographics and Text Combination
Infographics are frequently used alongside text to visualize complex ideas in an easily digestible manner. In McKinsey’s approach, infographics serve as quick summaries, while accompanying text offers a concise explanation. This combination allows for effective storytelling where visuals summarize vital points, and short text highlights the context or actionable insights.

Full-Text Slides
Although McKinsey typically avoids text-heavy slides, there are cases where full-text slides are necessary, such as summarizing key findings, presenting recommendations, or outlining the next steps. In these instances, McKinsey manages text-heavy slides by keeping the layout clean, using bullet points or short paragraphs, and ensuring ample white space to prevent visual overload. This seems to be a common pattern found in MBB consulting slides and in how the Big 4 consulting firms create presentations.
How McKinsey Handles Full Text Slides:
- Brevity: The text is concise, with short sentences and bullet points.
- Hierarchy: Headings or bold text differentiate between sections, making scanning easy.
- White Space: This helps avoid overcrowding and maintains clarity.
Text and Icons Slides
Slides that use text and icons are a staple in McKinsey’s deck. Icons are often used to represent concepts visually, breaking up text and adding an intuitive understanding of the point being made. For example, a slide might include a series of myths to be debunked; therefore, the presenter opts to show them with icons for easier recall while placing the “reality” next to each of those myths with their own icons.
Why Text and Icons Work:
- Simplification: Icons reduce the need for lengthy descriptions, making concepts easier to understand.
- Visual Interest: They make slides more engaging and less monotonous.
- Clear Organization: Icons help organize information into sections, allowing the audience to follow the narrative smoothly.
Conclusion Slides
Concluding your presentation shouldn’t be taken lightly in internal corporate slide decks. First, summarize the main points and insights drawn from the data. Based on that, provide specific, prioritized actions that the client should take. This takes us to a detailed outline of steps for immediate actions or implementation plans. That way, the attendees know how to proceed after the presentation concludes.
Keep the conclusion short, presenting the findings in 3-5 concise points. Highlights should only signal the most critical insights linked to the recommendations.
Recommended PPT Templates for McKinsey Styled Presentations
In this section, we’ll list down some of the best McKinsey slides PPT by SlideModel. Remember that some popular frameworks, like the 9 box model McKinsey or the McKinsey 7s model apply to specific aspects of organizational changes. The following list of McKinsey PowerPoint templates tackles the general style for McKinsey slides.
1. Consulting Proposal McKinsey PowerPoint Template
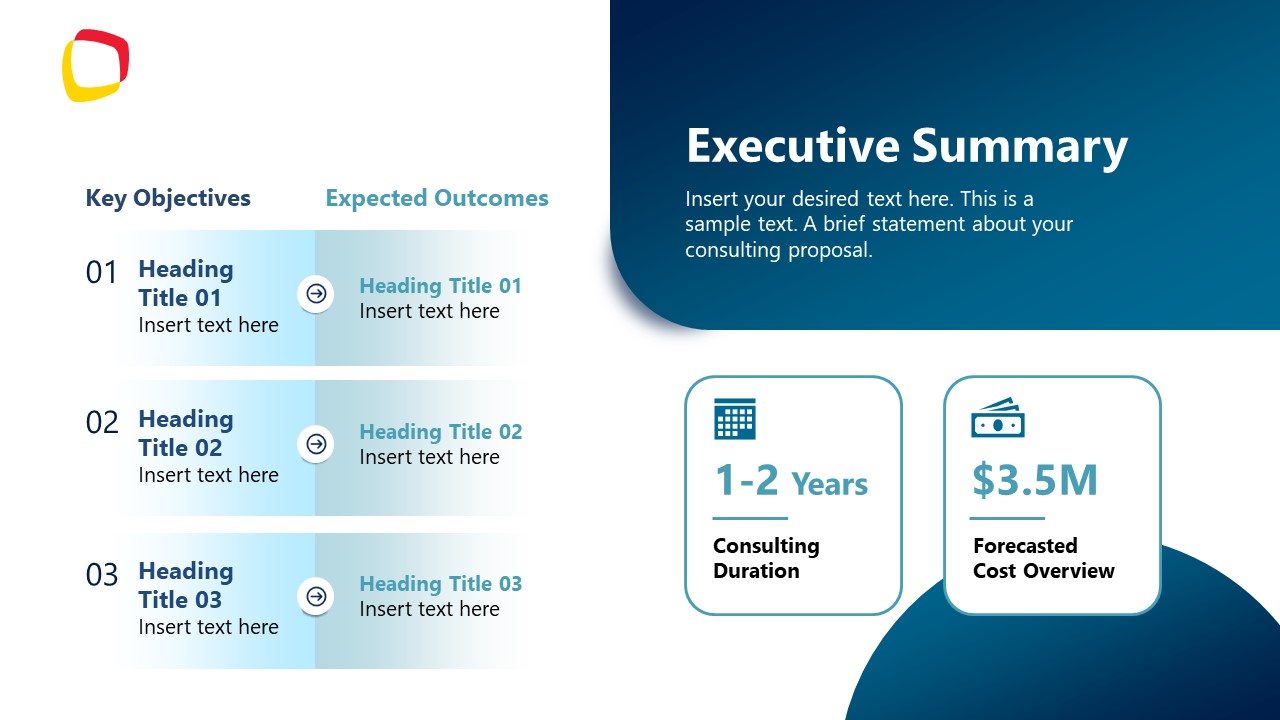
Transform your client pitches with our McKinsey-style Consulting Proposal PowerPoint Template. Designed to mirror the professionalism and clarity of top-tier consultancy presentations, this template is your key to delivering impactful messages. Featuring sleek layouts, data-driven charts, and strategic frameworks, it empowers you to present complex information seamlessly.
2. Strategy Consulting McKinsey PPT Template
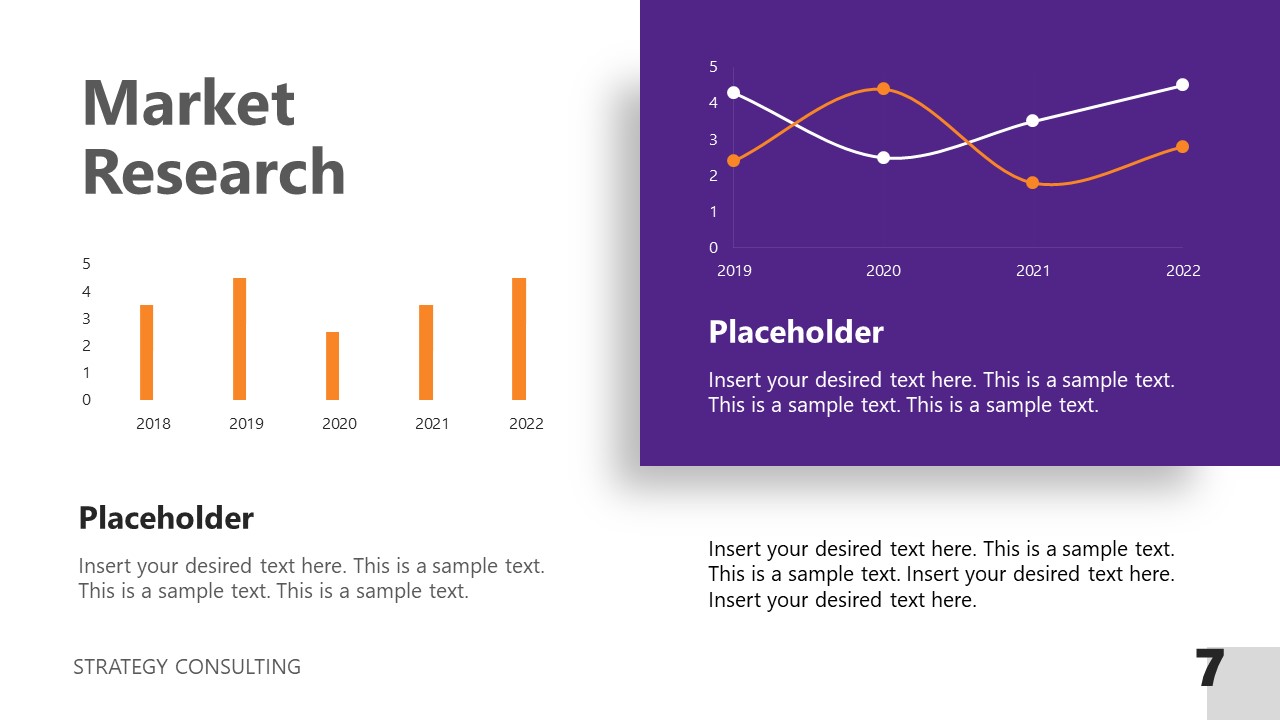
Elevate your strategic presentations with our Strategy Consulting PowerPoint Template, meticulously crafted to reflect the professional style of leading consulting firms like McKinsey. This comprehensive slide deck enables you to showcase your consultancy’s features, perks, and services in a manner that mirrors the clarity and impact of McKinsey presentations. Customize various PowerPoint objects and shapes to present your organization, services, and team effectively. Utilize image placeholders and data-driven chart slides to display market research statistics and insights, just as top-tier consultants do.
3. Consulting Report McKinsey Slide Deck
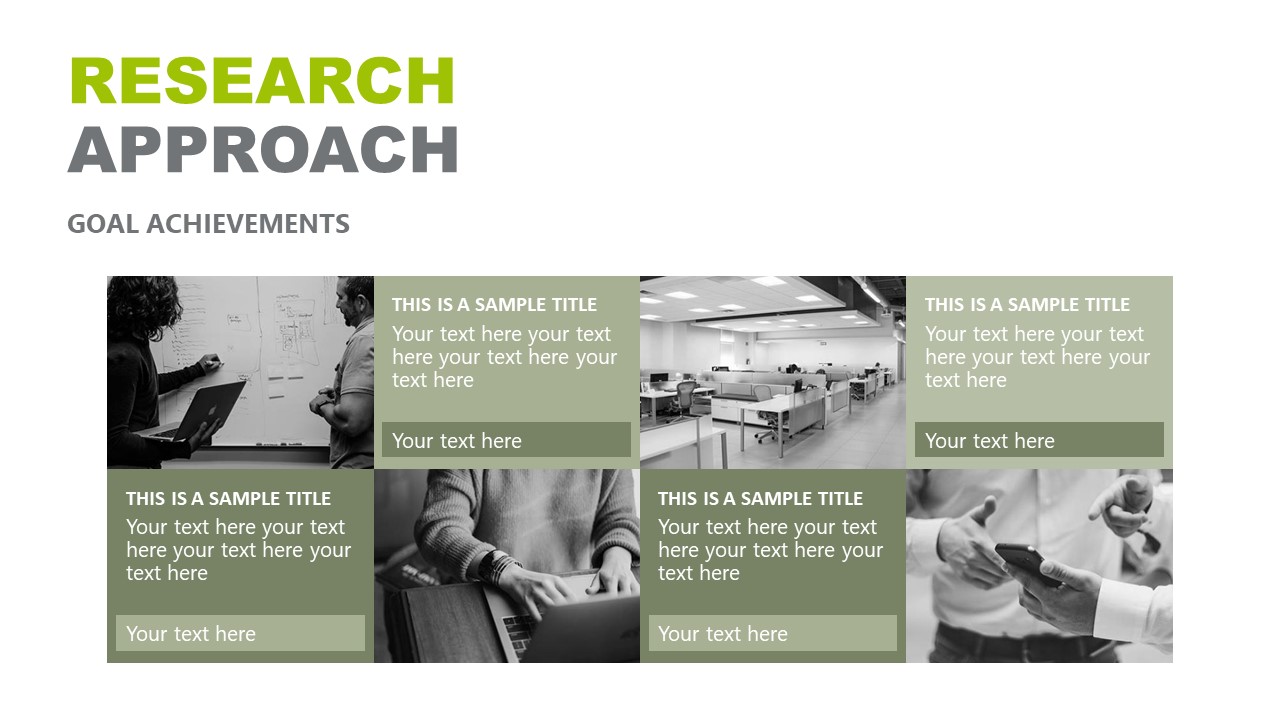
Mimicking the sleek aesthetics and structured layouts of top-tier consulting firms like McKinsey, the template features customizable graphics, data-driven charts, and modern infographics. It’s tailored to help you convey complex information effectively, whether you’re outlining strategic plans, showcasing market research, or delivering project summaries. The intuitive design enhances your storytelling, allowing you to communicate insights with authority and confidence.
Final Words
McKinsey’s presentation style is all about clarity, focus, and structured problem-solving. By organizing information logically, presenting data simply, and offering actionable recommendations, their presentations are designed to persuade and inform at the highest level. The guiding principles of McKinsey’s structure can be adopted in various industries and fields to improve communication effectiveness.