How to Outline Text in PowerPoint
Add creative effects to your slides by learning how to outline text in PowerPoint. An ideal solution to make texts stand out.

How to Select All Slides in PowerPoint
Speed up your slide design workflow by knowing how to select all slides in PowerPoint. Master the shortcuts and tips for this process.

How to Add Sections in PowerPoint
Edit your presentations by learning how to add a section in PowerPoint, name, rename or move it to match your preferences with this guide.

How to Mirror an Image in PowerPoint
Quickly customize your presentation slides by mirroring images in PowerPoint. Step-by-step process for single and multiple images.

How to Randomize Slides in PowerPoint
Join us today and learn how to code your first Macro to randomize slides in PowerPoint. Options for a fixed or uncertain number of slides.

How to Make a Venn Diagram in PowerPoint
Discover how easy is to make a Venn Diagram in PowerPoint with three different methods: SmartArt, PowerPoint shapes, and Venn Diagram PowerPoint Templates.

How to Blur an Image in PowerPoint
Customize your presentation slides with creative effects. Learn how to Blur an Image in PowerPoint with this article.

How to Change Default Font in PowerPoint
Speed up your presentation design by learning how to change default font in PowerPoint. Adapt your workflow to your design style with this guide!

How to Edit Footer in PowerPoint
Customize your PowerPoint presentations to featuring unique footers in the slides. Learn how to edit footer in PowerPoint with this guide.

How to Make Text Appear on Click in PowerPoint
Animate your slides by learning how to make text appear on click in PowerPoint. An ideal solution to increase audience engagement.

How to Print PowerPoint without Margins
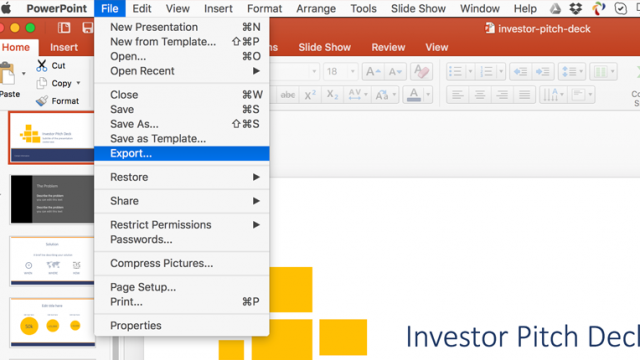
The documents printed in PowerPoint may wear an unwanted white border space or margin unless we configure the proper page size and scale options. In order to create borderless when exporting PowerPoint presentations to PDF format, you can follow the steps below. Here is a method to make borderless PDF presentations in your Mac by exporting your slides to images […]

How to Make Sub-Bullets in PowerPoint
Organize your content in presentation slides by learning how to make sub-bullets in PowerPoint.