Flat Bar Chart Diagram for PowerPoint
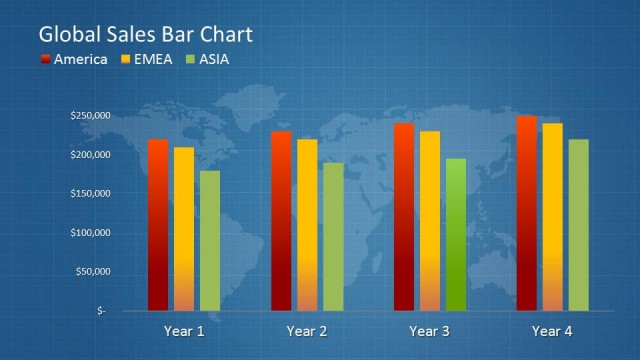
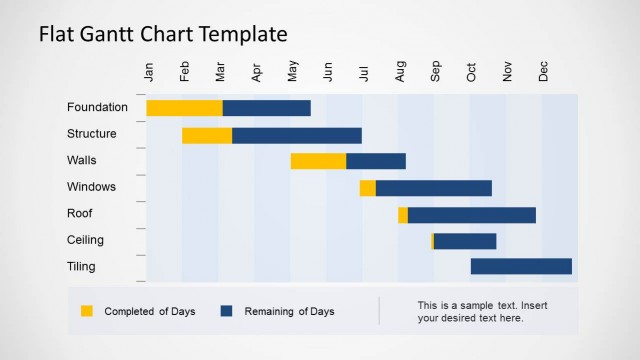
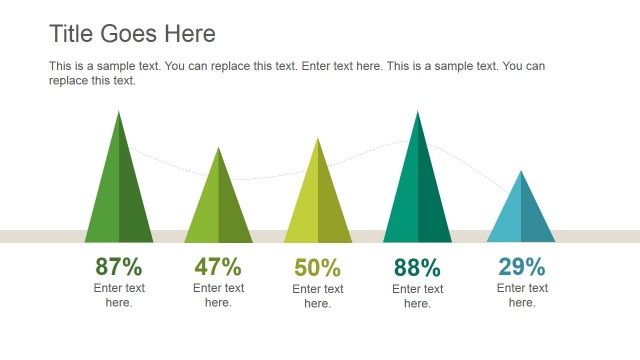
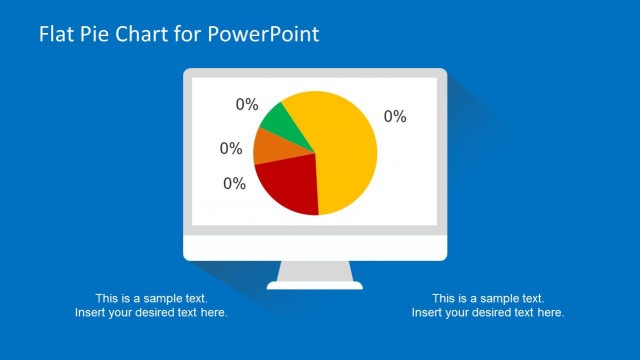
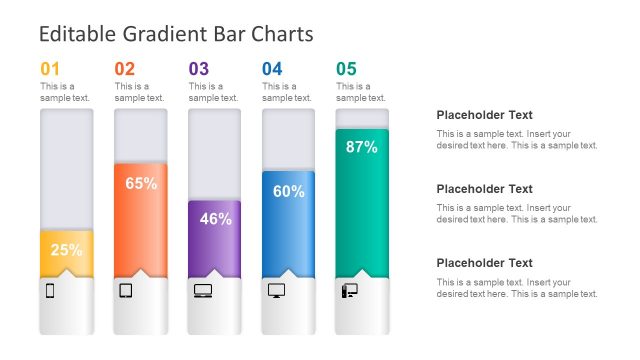
Flat Bar Chart Diagram for PowerPoint is a creative modern and customizable bar chart created with PowerPoint shapes and Data Drive PowerPoint charts. Ideal for simple data representations and impactful visual infographics.
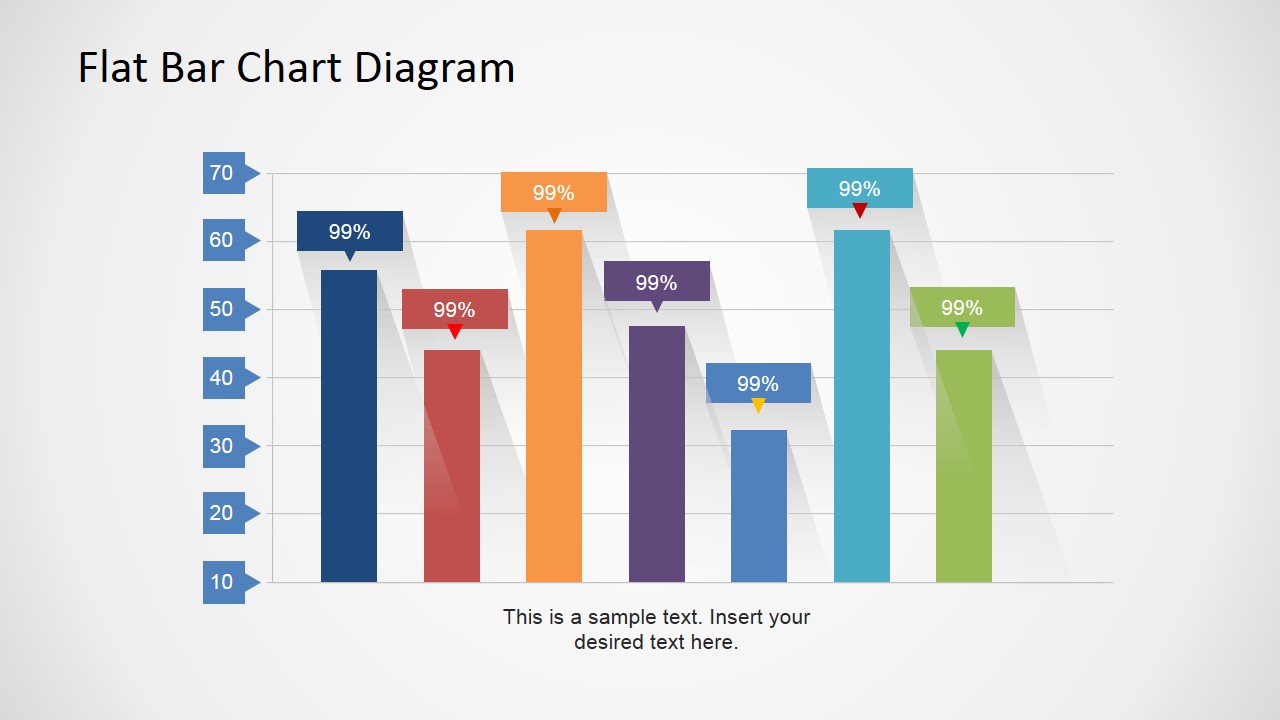
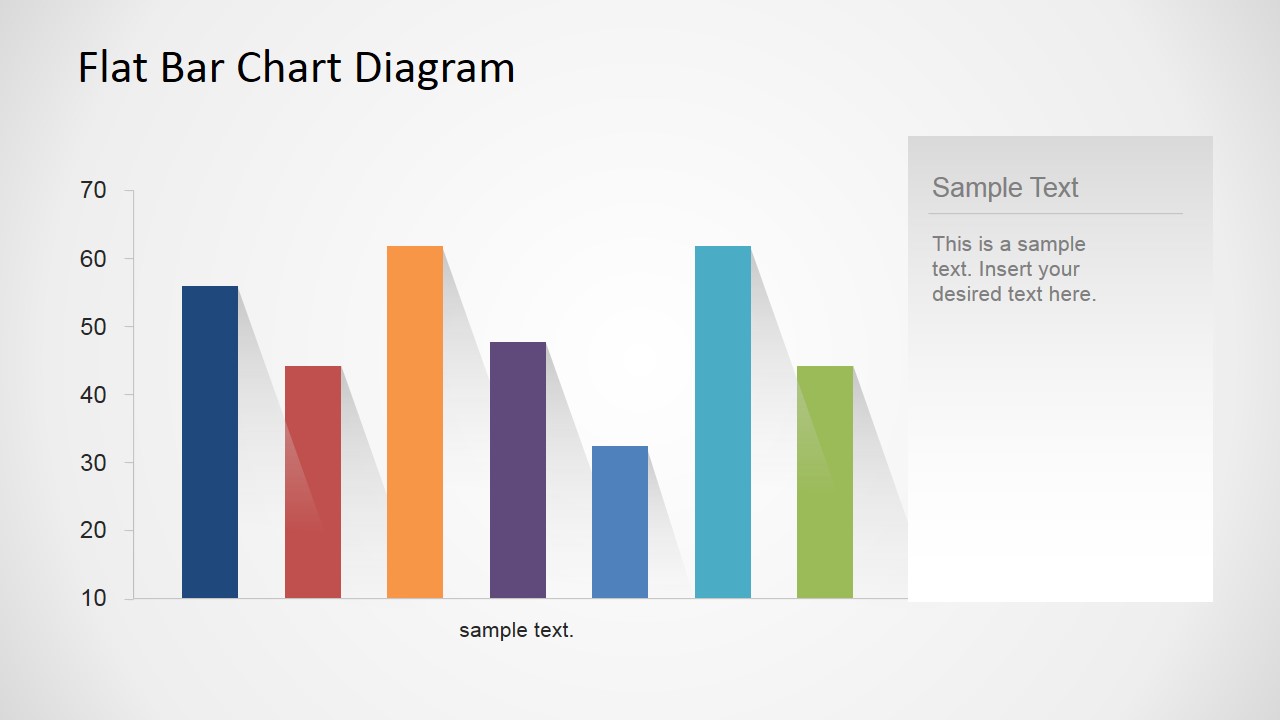
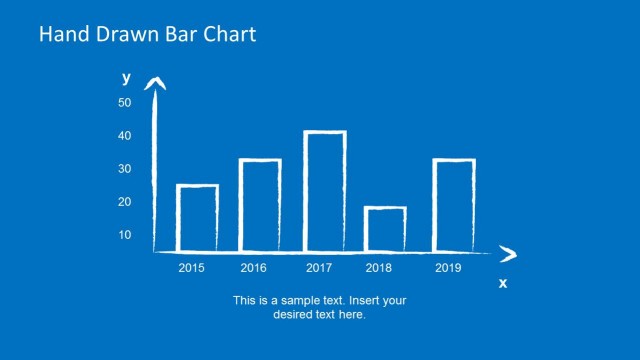
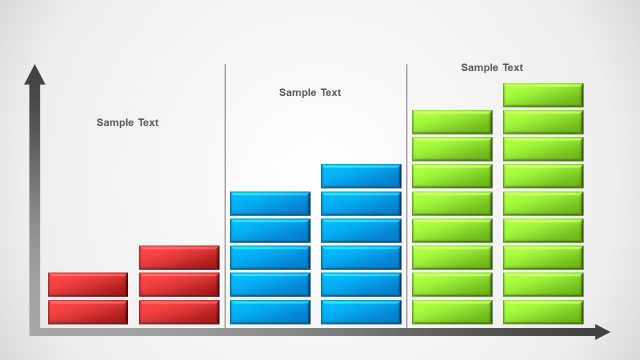
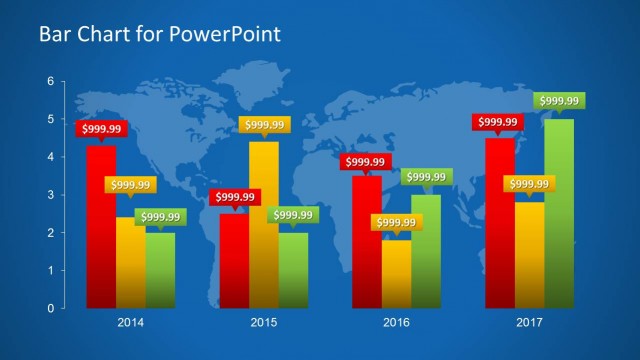
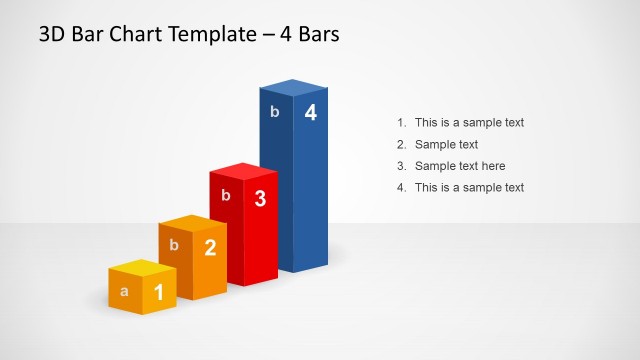
Bar Charts are a simple and powerful representation of data. In this specific PowerPoint presentation, the bars are displayed as columns. Each column represents a value or series. In the horizontal axis, each column represents a series, in the vertical axis, the columns achieve a representative value. Each column can be labeled with the appropriate relative percentage with the provided PowerPoint labels, created with PowerPoint shapes.
The PowerPoint Chart is customized to include Flat long shadows, providing a modern look and feel that appeals to executive audiences. The data-driven versions of the chart can be edited through excel. The user can quickly change the chart numbers and adapt the representation to its own values.
Users can create modern bar charts for accounting reports or quarterly review meetings. The ease of use of this PowerPoint template makes it ideal for stocks and financial presentations. Infographic presentations are very useful for summarizing complex data for non-specific audiences. Applying bar charts to compare numerical values is a professional technique that engages the audience.
Impress your audience with this modern flat design PowerPoint bar chart. Alternatively, you can download other presentation templates and bar chart PPT designs for presenting data to an audience.
