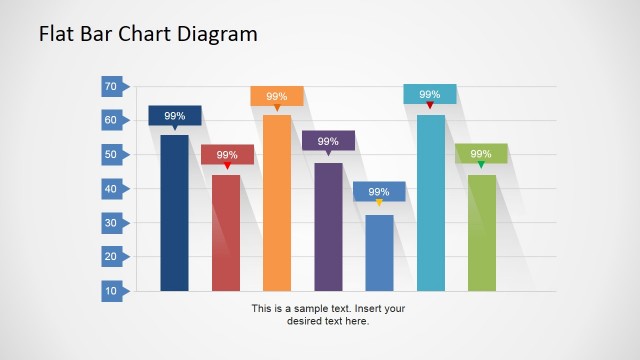
PowerPoint Flat Bar Chart with Shadows
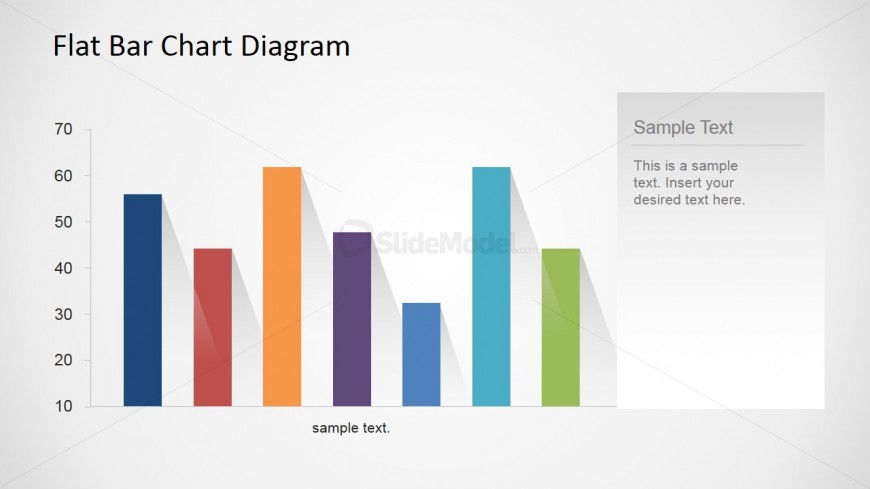
The slide design contains a PowerPoint Flat Bar Chart with Shadows. The bar chart can be used to compare different sets of statistical data across several time periods or various departments. It can be used to show a trend to analyze financial data. It can even be utilized in tracking specific growth rates.
The PowerPoint slide show seven vertical bars colored blue, red, yellow, violet, and green. They are of different heights to correspond to the volume of data they represent. Below the chart is a text placeholder where the title for the x-axis can be inserted. To the right of the slide is a text box where an explanation of the presentation can be placed. The PowerPoint objects are 100% customizable and can be edited to suit the presenter’s needs and preferences.
Return to Flat Bar Chart Diagram for PowerPoint.