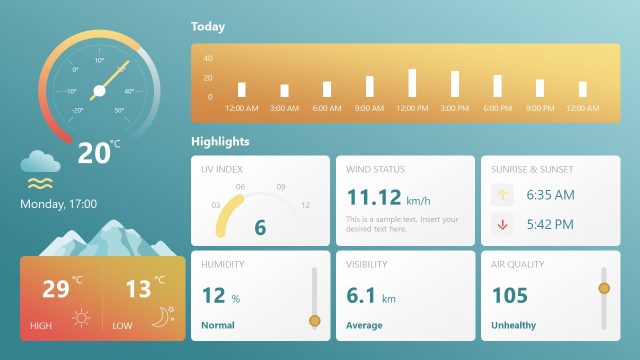
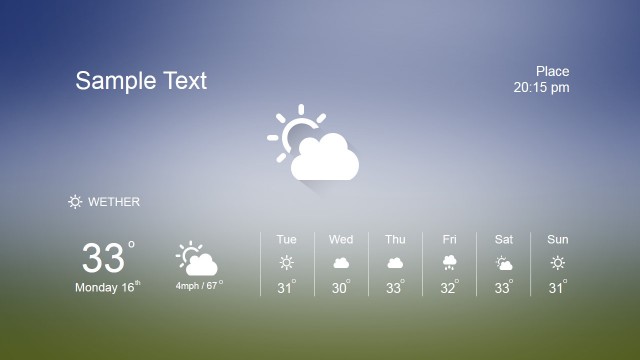
Weather Report Dashboard for PowerPoint is a visually appealing weather presentation template that can be used for presentations about the weather, weather reports or to add live weather information to digital signage.
A weather template for PowerPoint & Google Slides can be a great way to show off information via a dashboard presentation about the current meteorological conditions in any given area. This weather PowerPoint template design would include important facts and diagrams to present the weather forecast to an audience.
The overall design of the weather PPT template should be visually appealing and easy to read, while also giving detailed information. With this weather dashboard template for PowerPoint & Google Slides, you can depict a weather forecast per scheduled business plans, make presentations about different seasons and even create wireframes or UI designs by customizing the given sample slides and using the weather-themed clipart images.
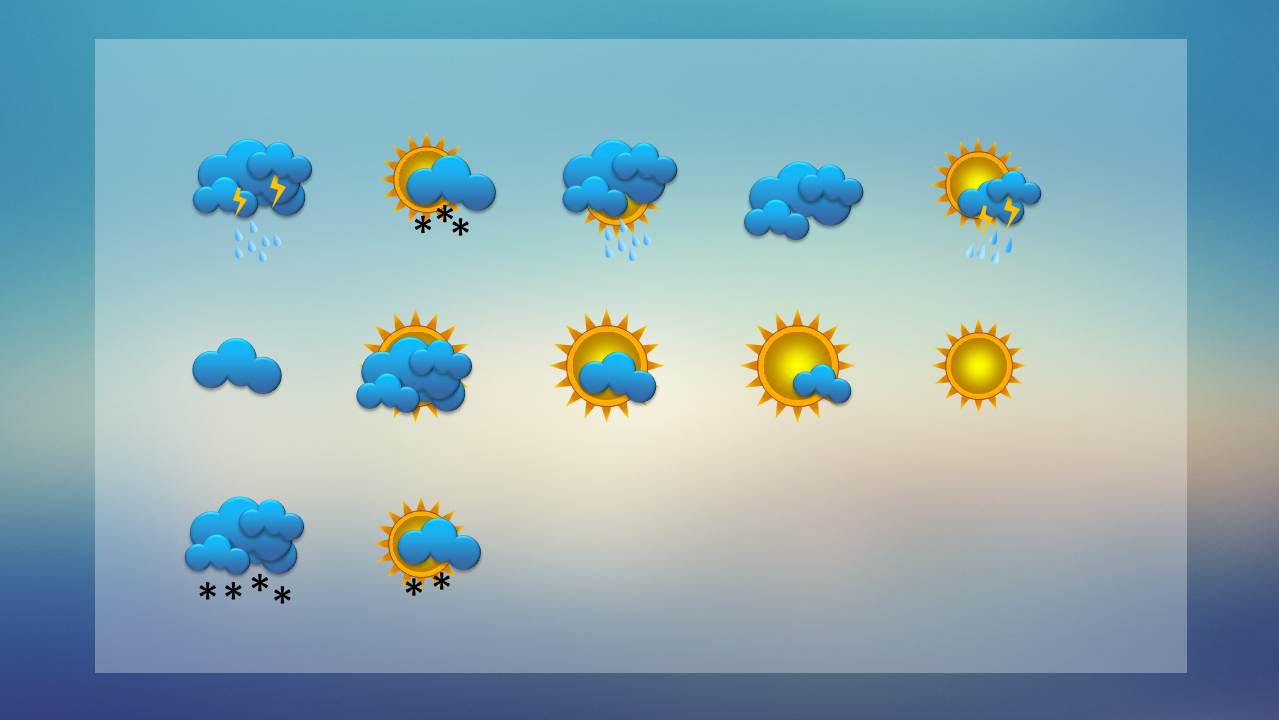
The clipart slide provides useful weather symbols, and you can also change the location, temperature, and other weather details on the main slide. Using this weather slide template, you can also prepare a weather report presentation in which you can include different weather icons and symbols.
What’s inside this template
Example presentation scenarios
- A local news presenter can use the dashboard slide to explain current temperature, weather condition, time, date, and a short forecast note during a brief on-screen update.
- An event coordinator can show expected conditions for venue planning by editing the city temperature list, weekly forecast strip, and weather icons to match the event location.
- A facilities or operations manager can use the current-condition panel and location list to communicate weather-related impacts before travel, shift changes, or outdoor work.
- An educator can use the weather icon sheet and dashboard layout to teach students how to read a forecast, compare conditions, and label weather symbols.
Features
- 100% editable presentation template
- Compatible with Microsoft PowerPoint and Google Slides
- 16:9 aspect ratio slides
- Scalable vector shapes, icons and illustrations
- AI-Ready for Microsoft Copilot and Claude
- Instant access and download
Frequently asked questions
Q: How should a presenter organize the weather message on this dashboard?
A: Start with the largest information first: location, current temperature, and condition icon. Then move to supporting details, including the time, date, city list, and weekly forecast strip. Keep the explanatory text short because the dashboard already carries several data points; the presenter should narrate the implication, not read every label.
Q: Who is this template best suited for?
A: This template fits presenters who need to communicate a quick weather snapshot rather than a technical forecast model. It works well for local briefings, event planning, operations updates, classroom examples, and signage mockups because the main slide combines current condition, forecast days, comparison locations, and a visual placeholder in one screen.
Q: Why does the dashboard layout improve weather communication?
A: Weather audiences scan for priority signals: temperature, condition, location, and timing. The layout places the large temperature panel on the left, a central image area for context, and supporting lists below and to the right. The icon sheet reinforces the metaphor of weather as instantly recognizable symbols, reducing reading time.



Weather Report Dashboard for PowerPoint
2-slide weather dashboard presentation template with local forecast panels and editable weather icons
Weather Report Dashboard for PowerPoint is a 2-slide weather presentation template for showing local conditions in Microsoft PowerPoint and Google Slides. It includes a local weather dashboard, current temperature panel, city temperature list, weekly forecast strip, image placeholder, and a separate weather icon sheet for forecast symbols.
- Category
- Template Backgrounds
- Rating


 Loading...
- Aspect ratio
- 16:9, 4:3
- Item ID
- 9112
- Colors
 Microsoft PowerPoint
 Microsoft Copilot
 Claude for PowerPoint
Other formats supported
Subscribe today and get immediate
access to download our PowerPoint templates.