Slide 1 of 2 from Weather Report Dashboard for PowerPoint
Weather Dashboard PowerPoint Template
Local Weather Report Dashboard for PowerPoint
- Media Layout
- Other
- Context Slide
- 16:9
- 100% Editable
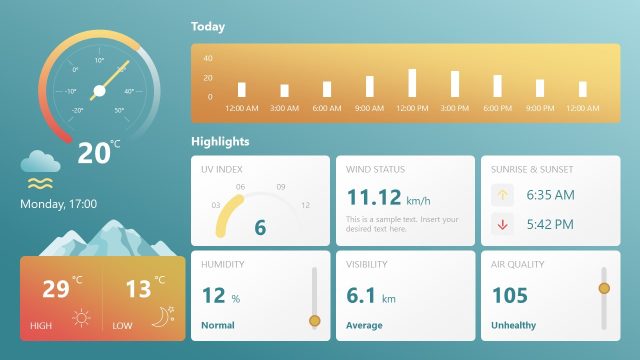
The Local Weather Report Dashboard slide from the Weather Report Dashboard for PowerPoint template offers a clear layout for presenting current weather conditions and forecasts. This slide template is designed for use in business presentations and community updates, featuring editable shapes and vector icons to visually communicate temperature data and weather status effectively. It supports quick comprehension in both formal and informal settings, making it a practical choice for slide decks focused on local weather information.
About This Slide
Weather dashboard created in PowerPoint presentations to make presentations on weather reports. This weather PowerPoint template contains placeholders where you can use your own pictures as well as placing the time and date.
What’s on This Slide
The layout features a left-aligned weather report with a temperature of 28°C and a rain icon. Below, a three-day forecast displays temperatures for Sunday, Monday, and Tuesday with corresponding weather icons. A central placeholder for an image is positioned at the top right, with a timestamp below it. The bottom section lists various cities and their temperatures, with Los Angeles highlighted. Text placeholders are present for the location and local weather details, aligned to the left and right respectively. The overall color scheme includes soft blues and yellows.
How to Use It
This layout serves as a weather report dashboard, ideal for presenting local weather conditions. It fits well at the beginning of a presentation to set the context for discussions on weather impacts. Scenarios include local business meetings discussing weather-related decisions or community updates on weather forecasts. The design allows for quick visual comprehension of current conditions and forecasts, making it suitable for both formal and informal settings.
Text Placeholders & Capacity
Keep your copy within these limits so it fits without resizing. Body slots can hold about 10-15 words each.
| Placeholder | Count | Max characters (approx.) |
|---|---|---|
| Slide title | 1 | 30 |
| Item body | 1 | 50 |
| Item body | 1 | 50 |
| Item body | 1 | 50 |
| Item heading | 1 | 20 |
Slide Keywords
Download unlimited PowerPoint templates, charts and graphics for your presentations with our annual plan.
DOWNLOADReturn to Weather Report Dashboard for PowerPoint.