Triangular Infographic Cycle Diagram PowerPoint Template
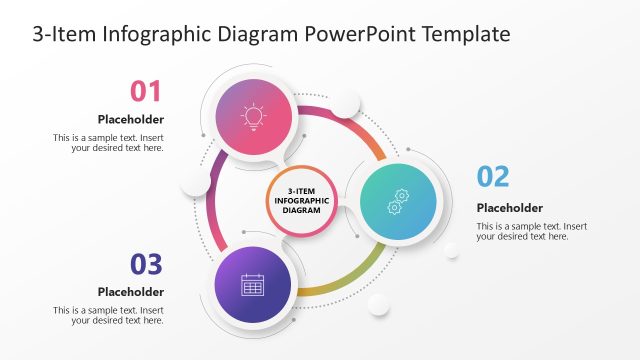
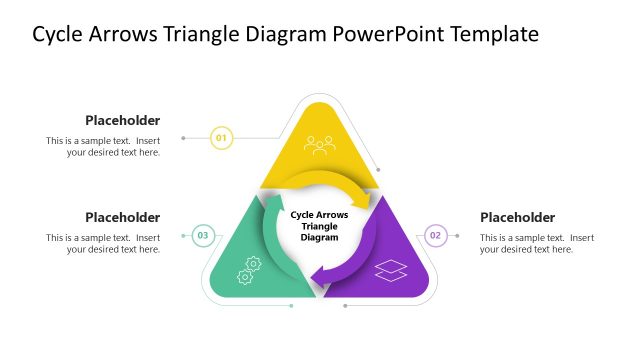
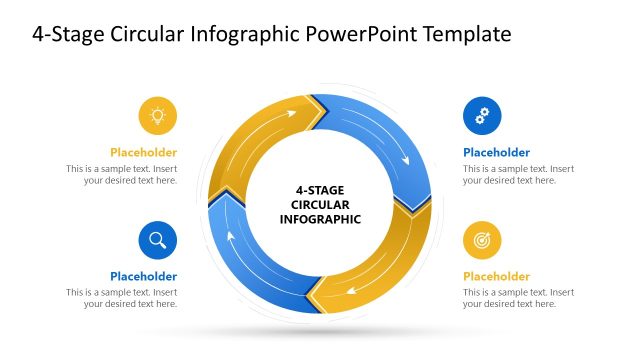
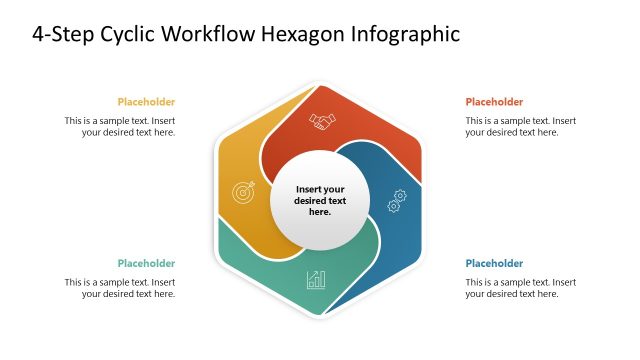
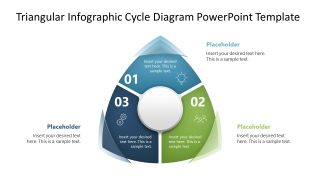
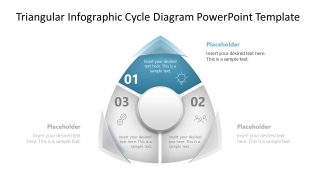
Present the phases in a manufacturing cycle in your stakeholder presentations for review and analysis using our Triangular Infographic Cycle Diagram PowerPoint Template. Every business process has a start and an end; however, some are cyclic, with the output of the last step feeding back into the first. To present the details of such a process, we designed this minimal three-step triangular infographic cycle diagram PPT template. This PowerPoint diagram is divided into three compartments, each explaining a phase or step of the process, concept, or methodology. Business and tech professionals can use it to present any iterative methodology. For instance, a quality assurance team lead can show their interns how to use the final assessment results for their products to feed their continuous improvement cycle. Likewise, presenters can customize it to present the sprint strategy to new teams. In this case, managers can explain how conclusions from one session pass on to the next cycle.
A product manager in a development team meeting can present how three different components, such as testing, user experience, and feedback, connect with each other. They can emphasize how skipping any stage impacts the overall outcome. The Triangular Infographic Cycle Diagram PowerPoint Template features a triangle diagram with rounded edges, giving it a circular appearance. Presenters can use relevant infographics in each segment to visually highlight the marketing concepts in their advertisement planning presentations. For instance, the three sections show continuous email marketing and follow-up steps. In the next three slides, HR professionals can discuss employee onboarding steps in their quarterly planning presentations, focusing on and color-highlighting each step individually. Download the triangular infographic cycle diagram and use it to illustrate the sequence of stages in a continual business process in executive presentations.


You must be logged in to download this file.
DOWNLOAD- Category
- Diagrams
- Rating

 Loading...
- Size
- 16x9
- Item ID
- 23635-01
- Colors
Subscribe today and get immediate
access to download our PowerPoint templates.