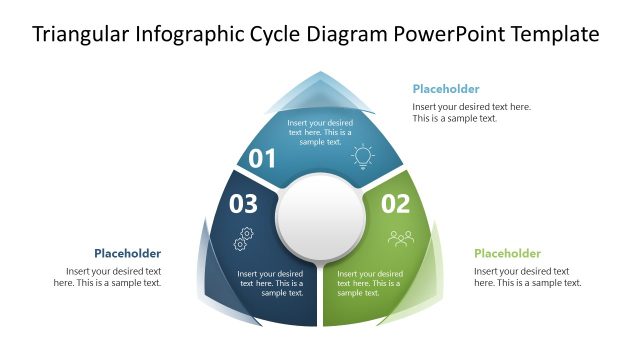
Slide 2 of 4 from Triangular Infographic Cycle Diagram PowerPoint Template
Triangular Infographic Cycle Diagram Layout
Triangular Cycle Diagram for Presentations
- Diagram
- Process Flow
- Process Slide
- 16:9
- 100% Editable
The Triangular Cycle Diagram slide from the Triangular Infographic Cycle Diagram PowerPoint Template offers a clear visual for illustrating three-stage processes in business presentations. This slide layout uses editable shapes and vector icons to highlight sequential steps, making it suitable for project phase overviews and product development stages within a corporate presentation or pitch deck template.
What’s on This Slide
The layout features a triangular diagram divided into three sections, each representing a stage. The top section highlights step 1, while the left and right sections denote steps 2 and 3, respectively. Each section contains a circular node for text with a placeholder for content. The central area is also a circular node, emphasizing a key concept. Numbering is present in each section, with icons representing each stage. The background is light, and the color scheme includes shades of blue and gray, creating a clear visual hierarchy.
How to Use It
This layout serves as a process flow diagram, ideal for illustrating a three-stage cycle. It fits well in presentations discussing business processes, project phases, or product development stages. Use it to visually represent sequential steps in a workflow or to highlight key components in a strategy. This slide is effective in both team meetings and client presentations where clarity in process explanation is needed.
Text Placeholders & Capacity
Keep your copy within these limits so it fits without resizing. Node body slots can hold about 15-20 words each.
| Placeholder | Count | Max characters (approx.) |
|---|---|---|
| Item heading | 3 | 2 |
| Item body | 3 | 100 |
| Item body | 1 | 100 |
Slide Keywords
Download unlimited PowerPoint templates, charts and graphics for your presentations with our annual plan.
DOWNLOADReturn to Triangular Infographic Cycle Diagram PowerPoint Template.