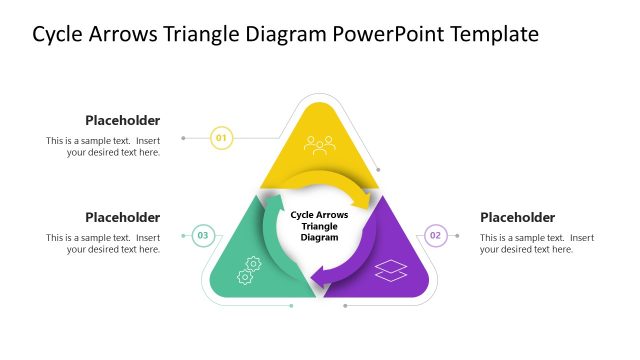
Slide 1 of 4 from Triangular Infographic Cycle Diagram PowerPoint Template
Triangular Infographic Cycle PPT Diagram Template
Triangular Cycle Diagram for Presentations
- Diagram
- Segmented Wheel
- Process Slide
- 16:9
- 100% Editable
The Triangular Cycle Diagram slide from the Triangular Infographic Cycle Diagram PowerPoint Template offers a clear visual for illustrating three-stage business processes. This slide layout uses editable shapes and vector icons to highlight project stages or product development cycles, making it a practical choice for corporate presentations and pitch deck templates that require concise process visualization.
What’s on This Slide
The layout features a triangular diagram divided into three sections, each labeled with numbers 01, 02, and 03. Each section contains a text placeholder positioned centrally, allowing for text insertion. A central circular placeholder is located in the middle of the triangle, providing space for a key concept. The sections are color-coded with distinct shades, creating a visual hierarchy. The overall composition is balanced, with the triangle centered on the slide, and the background is white, enhancing clarity and focus on the diagram.
How to Use It
This layout serves as a three-stage process diagram, ideal for illustrating cyclical business processes or workflows. It fits well in presentations that require a clear visual representation of sequential steps. Common scenarios include project management, product development cycles, or strategic planning discussions. This layout can effectively communicate complex processes in a simplified manner, making it suitable for both internal team meetings and client presentations.
Text Placeholders & Capacity
Keep your copy within these limits so it fits without resizing. Node body slots can accommodate roughly 15-20 words each.
| Placeholder | Count | Max characters (approx.) |
|---|---|---|
| Item heading | 3 | 20 |
| Item body | 3 | 100 |
| Item body | 1 | 100 |
Slide Keywords
Download unlimited PowerPoint templates, charts and graphics for your presentations with our annual plan.
DOWNLOADReturn to Triangular Infographic Cycle Diagram PowerPoint Template.