Slide 4 of 4 from Triangular Infographic Cycle Diagram PowerPoint Template
Engaging Triangular Infographic Cycle Diagram
Triangular Cycle Diagram for Presentations
- Diagram
- Triangular Cycle
- Process Slide
- 16:9
- 100% Editable
The Triangular Cycle Diagram slide from the Triangular Infographic Cycle Diagram PowerPoint Template offers a clear process illustration with editable shapes and vector icons. Designed to depict three-stage cycles such as project phases or marketing strategies, this slide layout supports business presentations and pitch decks requiring precise visualization of sequential steps in a slide deck.
What’s on This Slide
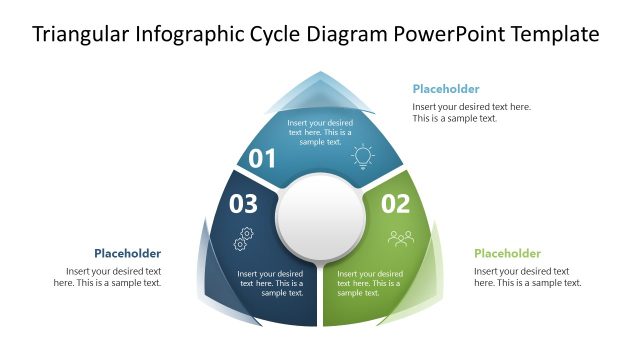
The layout features a triangular diagram divided into three sections, each labeled 01, 02, and 03. The sections are arranged in a clockwise direction, with the central area containing a circular placeholder for key concepts. Each triangular segment has a corresponding text placeholder positioned below it, aligned to the left. The background is predominantly white, with a gradient effect on the triangle sections. The visual hierarchy emphasizes the numbered sections, while the central circle is visually distinct, allowing for clear content placement.
How to Use It
This layout serves as a process flow diagram, ideal for illustrating a three-stage cycle. It fits well in presentations that require a clear depiction of sequential steps or stages in a business context. Use it to outline processes such as project phases, product development stages, or marketing strategies. The design allows for easy customization of text and icons, making it suitable for various topics that involve cyclical or iterative processes.
Text Placeholders & Capacity
Keep your copy within these limits so it fits without resizing. Node body slots can hold roughly 15-20 words each.
| Placeholder | Count | Max characters (approx.) |
|---|---|---|
| Item heading | 3 | 30 |
| Item body | 3 | 100 |
| Body paragraph | 4 | 100 |
Slide Keywords
Download unlimited PowerPoint templates, charts and graphics for your presentations with our annual plan.
DOWNLOADReturn to Triangular Infographic Cycle Diagram PowerPoint Template.