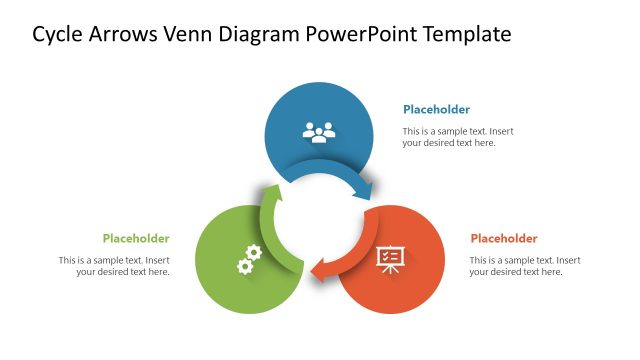
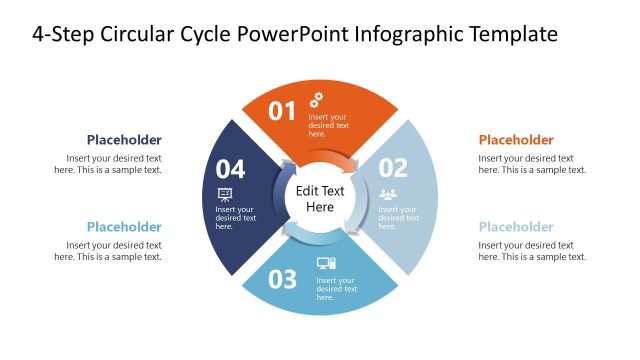
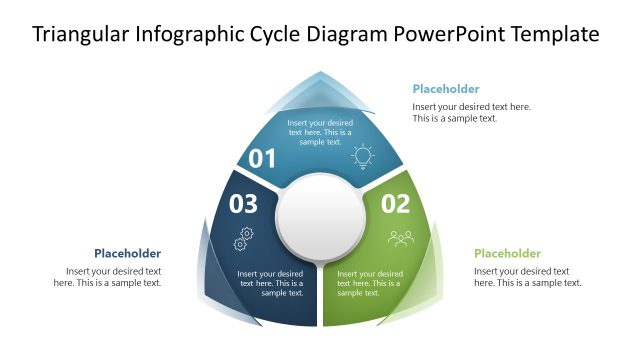
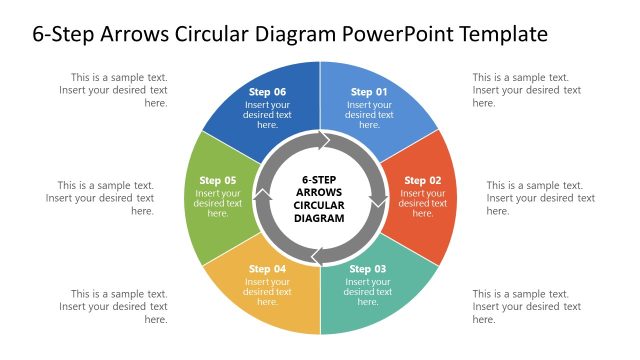
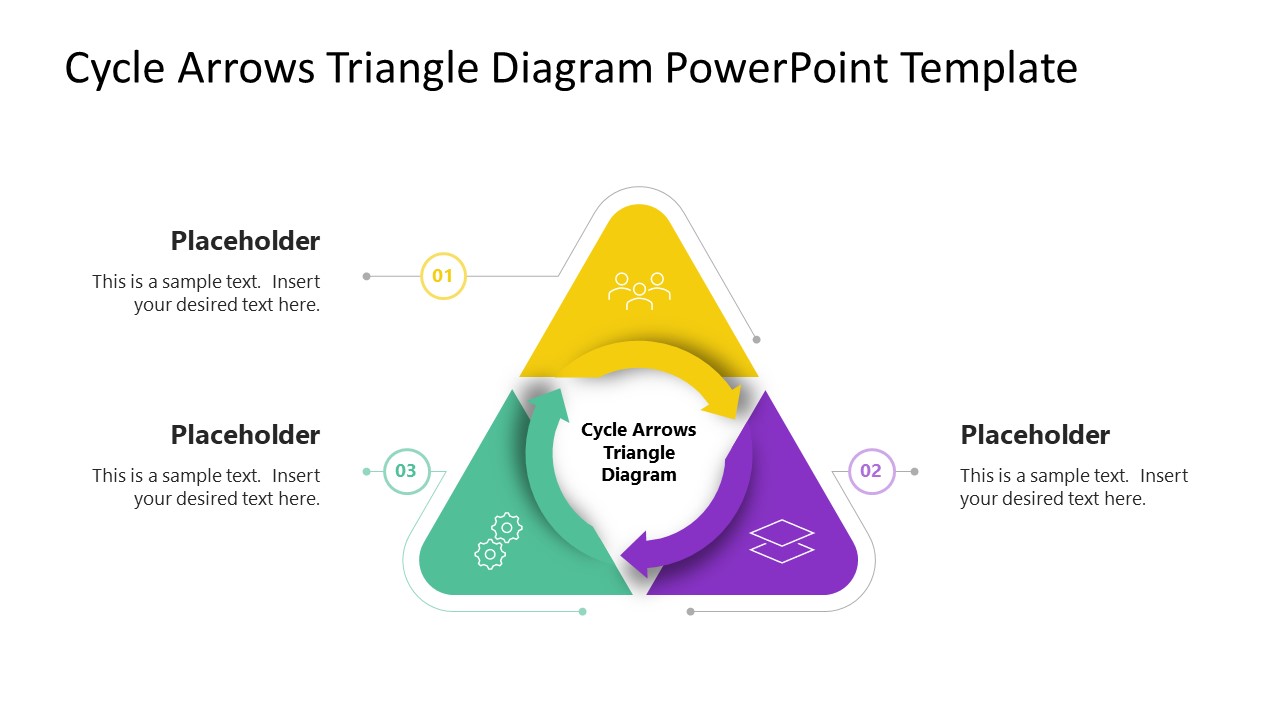
Demonstrate the stages in a recurring business process using our customizable Cycle Arrows Triangle Diagram PowerPoint Template. The cyclic diagram helps professionals visualize how one stage feeds into the next, keeping the audience engaged. Quality assurance managers use the three circular-arrow diagrams to present an iterative quality framework. Analysts, in their client sessions, map the assets, implementation, and review stages in a digital transformation presentation. A product strategist presents a customer feedback loop and explains each step clearly, using three circular arrows and infographics. Also, the cycle arrow triangle diagram PPT design is useful for other process-focused presentations.
This PPT template features three circular arrows to showcase a cyclic process. With each arrow, there is an attached segment that, in combination, produces a triangular diagram. The corresponding colors of arrows, shapes, and text placeholders allow quality control managers to showcase distinct process steps, enabling the audience to quickly grasp the key information in the presentation. In each section, project managers can use infographics to display the monthly project improvement steps to their teams visually. There is a thin outline around the triangular corner that makes the step number and points to the relevant placeholder text section.
After the cover slide, operations directors represent the stages of the continuous improvement process, using a distinct, focused effect. These slides contain the same diagram but highlight only one step in color. The Cycle Arrows Triangle Diagram PowerPoint Template is compatible with all versions of PowerPoint, and users can adjust the layout to suit their specific needs. Download the cycle arrows triangle diagram PPT template for your next executive presentation and outline the QC steps comprehensively.
What’s inside this template
Example presentation scenarios
- A quality assurance manager can explain a continuous improvement cycle by starting with the full-color triangle diagram and then moving through the step highlight slides.
- A project manager can brief a team on a recurring review workflow by using the numbered side callouts to assign actions, owners, or decision points.
- A business analyst can map a digital transformation loop by labeling the three colored arrow segments as current state review, implementation, and measurement.
- A product strategist can present a customer feedback cycle by using the full cycle view for context and the single-step highlight slides for deeper discussion.
Features
- 100% editable presentation template
- Compatible with Microsoft PowerPoint
- 16:9 aspect ratio slides
- Scalable vector shapes, icons and illustrations
- AI-Ready for Microsoft Copilot and Claude
- Instant access and download
Frequently asked questions
Q: How should a presenter explain the three-step cycle without making it feel repetitive?
A: Start with Slide 1 to show the complete loop and name the outcome the cycle produces. Then use Slides 2, 3, and 4 to isolate one segment at a time. Keep each callout focused on the action, owner, and handoff, so the audience understands both the stage and how it feeds the next step.
Q: Who is this diagram best suited for in a business presentation?
A: This template fits presenters who need to simplify a recurring workflow for stakeholders, teams, or clients. Operations, quality, project, and product teams can use the three-arrow triangle to explain improvement loops, review cycles, feedback processes, or implementation stages where the final step returns to the first.
Q: Why use a triangular circular arrow diagram instead of a list?
A: The triangular cycle makes recurrence visible. A list can imply that the process ends after the third item, while the circular arrows show continuous movement. The focused highlight slides also reduce visual noise by muting inactive stages, helping the presenter discuss one step while preserving the full loop context.






Cycle Arrows Triangle Diagram PowerPoint Template
4-slide PowerPoint diagram template for three-step cycle arrows, process flow, and editable callouts
Cycle Arrows Triangle Diagram PowerPoint Template is a 4-slide Microsoft PowerPoint deck for explaining three-step recurring processes. It includes a full-color circular arrow triangle, three focused step highlight slides, numbered side callouts, and small line icons for teams, layers, and settings.
- Category
- Diagrams
- Rating

 Loading...
- Aspect ratio
- 16:9
- Item ID
- 23611-01
- Colors
 Microsoft PowerPoint
  Microsoft Copilot
  Claude for PowerPoint
 Other formats supported
Subscribe today and get immediate
access to download our PowerPoint templates.