Slide 1 of 4 from Three Horizons Model Curve for PowerPoint
3 Horizon Model Curve for PowerPoint
Three Horizon Model Curve for PowerPoint
- Diagram
- Other
- Strategy Slide
- 16:9
- 100% Editable
What’s on This Slide
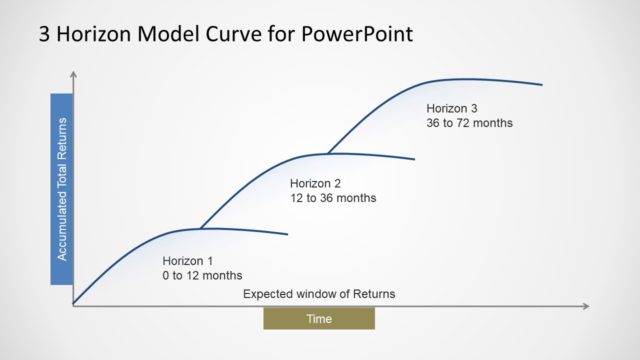
The slide features a curve diagram illustrating the Three Horizons Model. The horizontal axis represents the expected window of returns, while the vertical axis indicates accumulated total returns. Three distinct horizons are labeled: Horizon 1 (0 to 12 months), Horizon 2 (12 to 36 months), and Horizon 3 (36 to 72 months). The curve transitions smoothly from red to green, indicating growth phases. A figure label is positioned at the bottom center. Text placeholders exist for titles and axis labels, emphasizing the visual hierarchy of the diagram.
How to Use It
This layout serves to illustrate business growth stages over time using the Three Horizons Model. It is suitable for presentations on strategic planning, investment forecasting, or performance analysis. The diagram can be used to explain how returns accumulate over different time horizons, making it effective for stakeholders assessing growth strategies. In a presentation sequence, it typically follows problem identification slides and precedes detailed analysis or recommendations.
Text Placeholders & Capacity
Keep your copy within these limits so it fits without resizing. Text slots are spacious, allowing for detailed labels and titles.
| Placeholder | Count | Max characters (approx.) |
|---|---|---|
| Slide title | 1 | 30 |
| Item heading | 3 | 20 |
| Chart title | 1 | 30 |
| Axis label | 2 | 30 |
| Figure | 1 | 10 |
Slide Keywords
Download unlimited PowerPoint templates, charts and graphics for your presentations with our annual plan.
DOWNLOADReturn to Three Horizons Model Curve for PowerPoint.