Slide 4 of 4 from Three Horizons Model Curve for PowerPoint
6227-03-three-horizon-model-curve-4
Three Horizon Model Curve for PowerPoint
- Diagram
- Other
- Strategy Slide
- 16:9
- 100% Editable
The Three Horizon Model Curve slide from the Three Horizons Model Curve for PowerPoint template offers a clear visual tool for strategic planning and business growth presentations. This diagram slide uses editable shapes and vector icons to illustrate growth phases over time, making it suitable for corporate presentations and investment strategy meetings. Its design supports effective communication of complex growth options within a professional slide deck.
What’s on This Slide
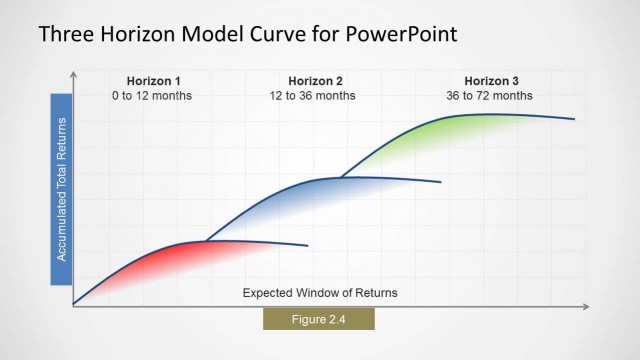
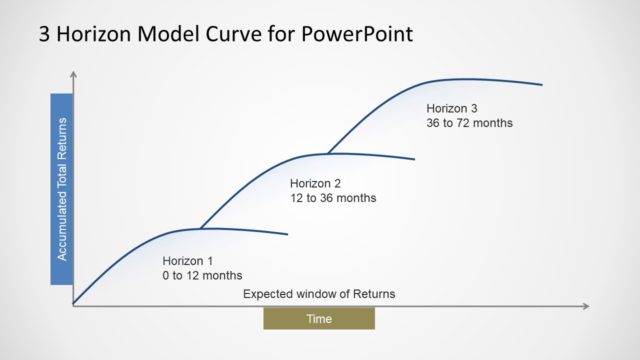
The slide features a curve diagram illustrating the Three Horizons Model. The horizontal axis represents the expected window of returns, while the vertical axis shows accumulated total returns. Three distinct horizons are labeled: Horizon 1 (0 to 12 months), Horizon 2 (12 to 36 months), and Horizon 3 (36 to 72 months). A blue box labeled 'Growth Options' contains text about future high-growth businesses. The curve transitions from red to green, indicating growth stages. Text placeholders exist for titles and figure captions.
How to Use It
This layout serves as a visual representation of the Three Horizons Model, useful for discussing business growth strategies over time. It fits into a presentation sequence following problem identification and analysis slides, providing a framework for strategic planning. This slide is applicable in business contexts where growth phases need to be communicated, such as strategic planning sessions or investment discussions.
Text Placeholders & Capacity
Keep your copy within these limits so it fits without resizing. Node labels can accommodate roughly 3-4 words each.
| Placeholder | Count | Max characters (approx.) |
|---|---|---|
| Slide title | 1 | 30 |
| Item heading | 3 | 20 |
| Item body | 1 | 50 |
| Chart title | 1 | 40 |
| Footer | 1 | 20 |
Slide Keywords
Download unlimited PowerPoint templates, charts and graphics for your presentations with our annual plan.
DOWNLOADReturn to Three Horizons Model Curve for PowerPoint.