Tables with Symbols for PowerPoint
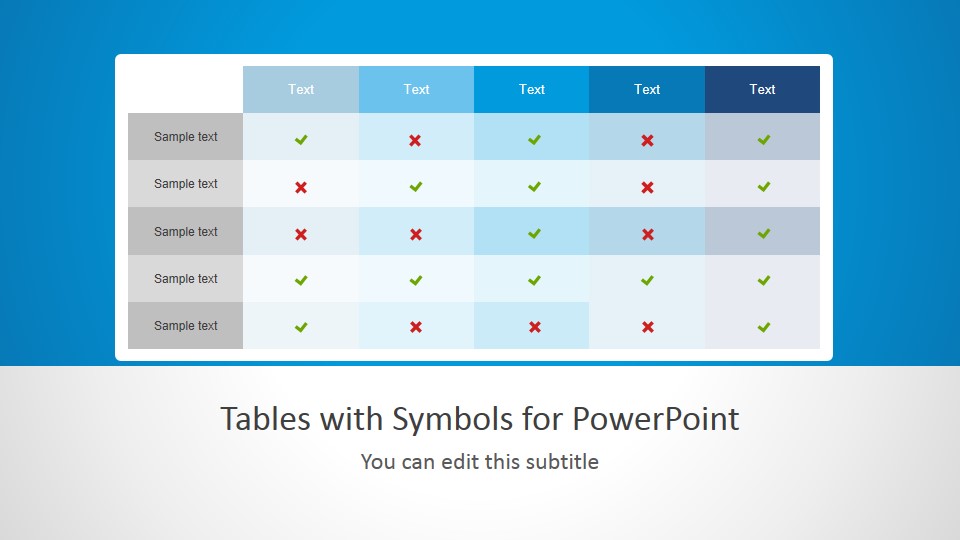
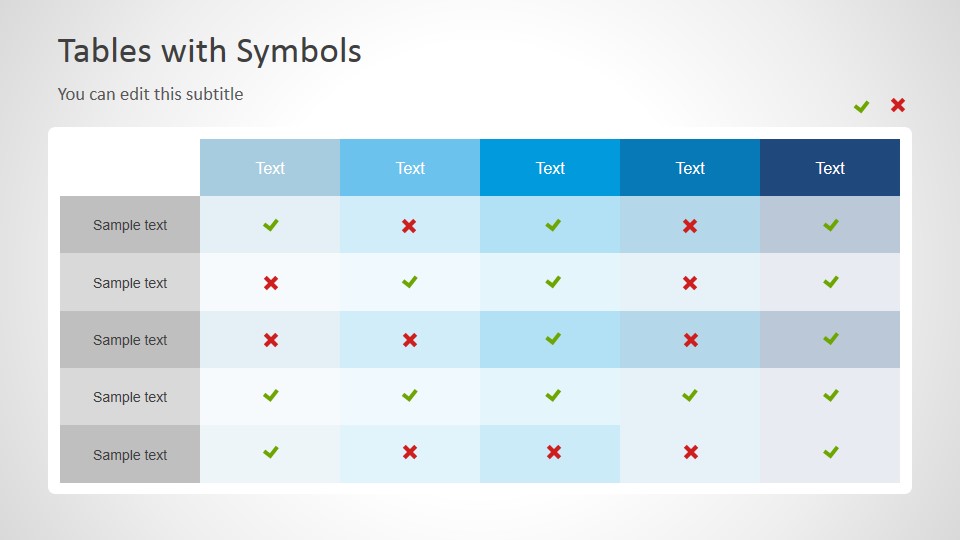
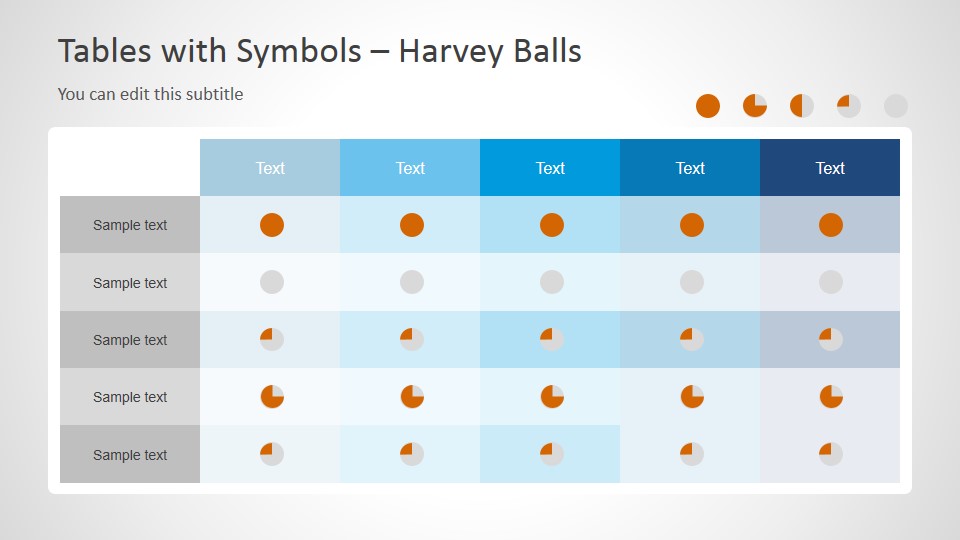
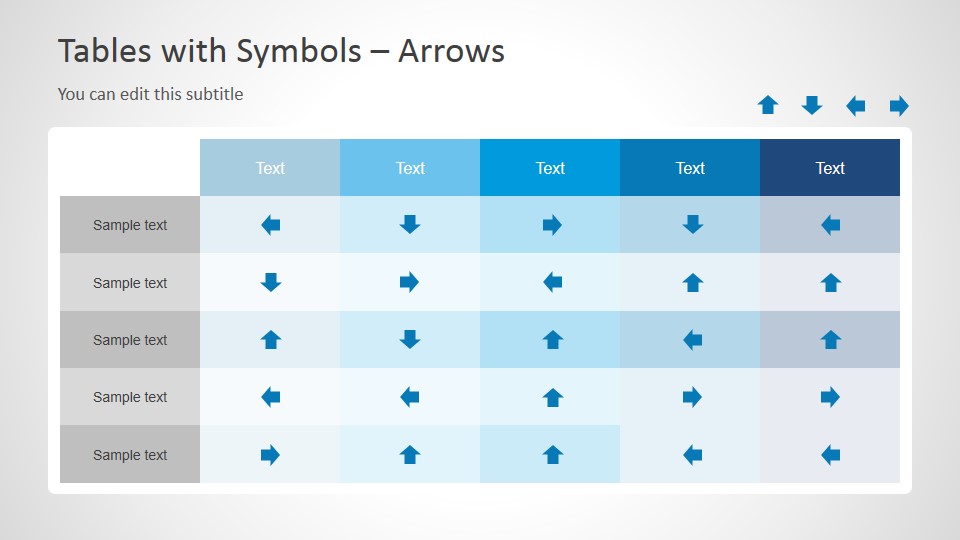
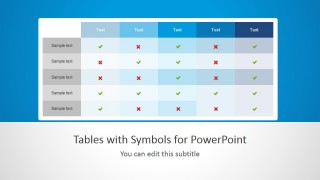
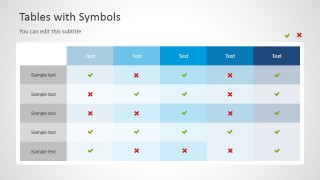
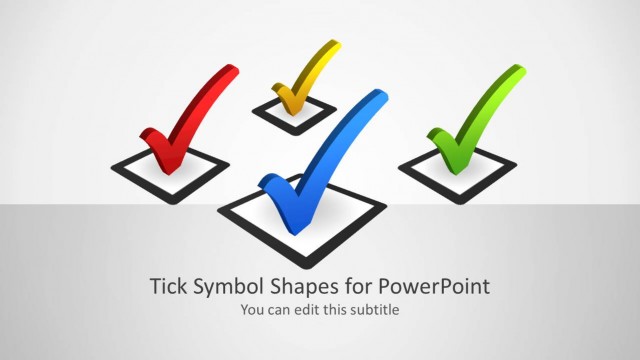
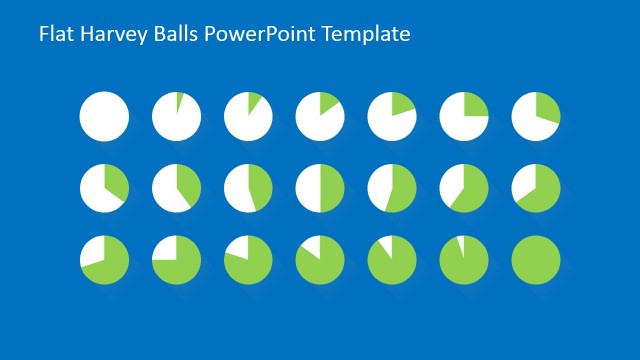
Tables with Symbols for PowerPoint to visualize and convey data tables in wide varieties and several graphics to fill the table fields such as Harvey Balls, arrows, and the tick symbols.Use the tables to quickly give information about trends, sales, spending, comparisons and project analysis. This communicates the information in a pictorial overview instead of the lengthy reading and evaluation of individual data.
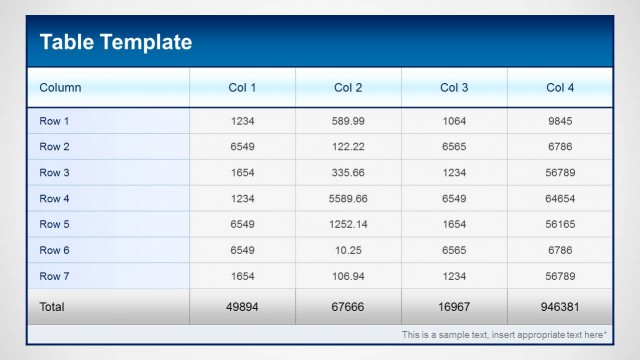
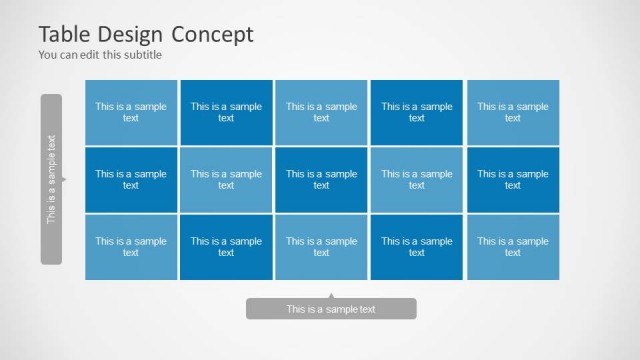
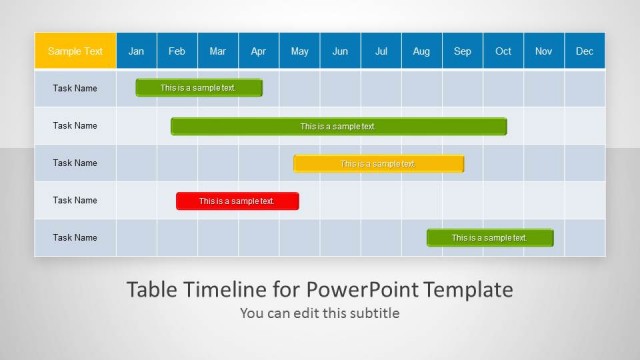
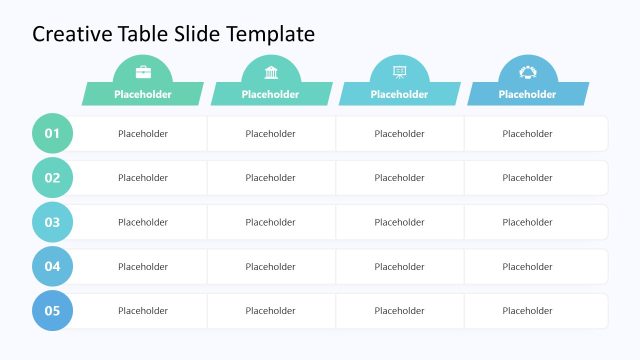
This PowerPoint template includes a different set of table templates with columns, rows, and symbols to fill the table cells. The tables can be quickly labeled and edited. It only takes a few seconds to insert text and symbols, modify the look or filled the cells with matching graphics.
In showing expenditures, for example, were higher than a certain percentage of the budget, insert a check icon for higher and a cross icon for not higher in the table fields based on their respective years.
With the Tables with symbol graphics for PowerPoint, it is easy to create reports on data volumes with matching symbols fill using the professionally designed table templates. Check more ready to use template, tables and business models for PowerPoint that best matches the business needs. Find easy to edit presentation templates for PowerPoint.
