Large chunks of data, text areas, and complex business jargon are common pitfalls of presentation slides. But what if we tell you that the recipe for success in slide decks is the visuals? You can explain all those elements in a more cohesive format that helps the audience grasp the knowledge you aim to transmit. Among the many tools in the arsenal of presenters, Harvey Balls deserve a special mention due to their role in simplifying comparisons in presentations and reports. In this post, we will tell you all about using Harvey Balls in PowerPoint.
Table of Content
- What are Harvey Balls?
- History of Harvey Balls
- Harvey Balls and Visual Communication
- Why Use Harvey Balls in Your PowerPoint Presentations?
- Tips to Make Your Harvey Balls Look Professional and Attractive
- Pros and Cons of Using Harvey Balls
- How to create Harvey Balls in PowerPoint?
- Harvey Ball PowerPoint Templates
- Harvey Balls Alternatives for Presenters
- Final Words
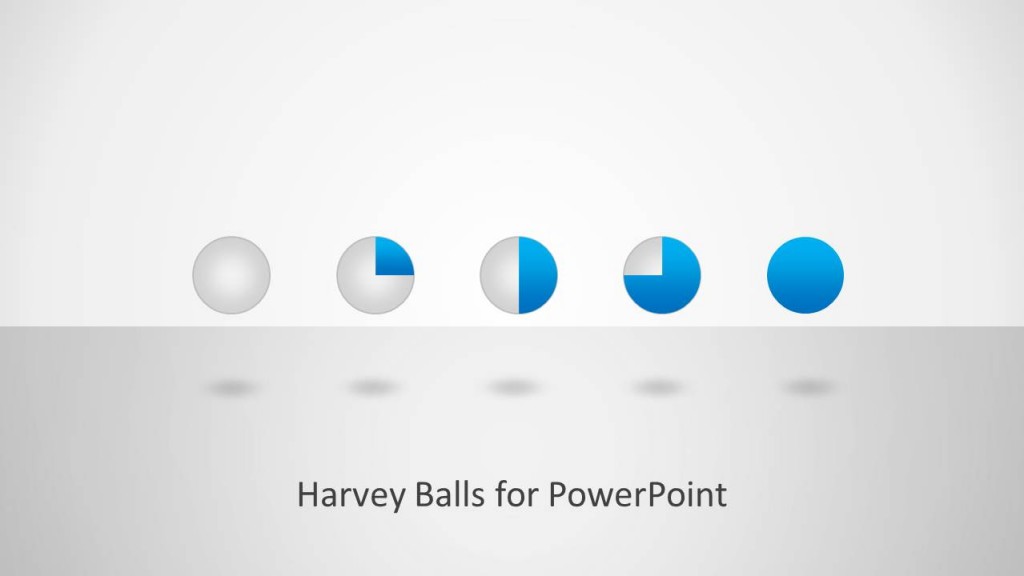
What are Harvey Balls?
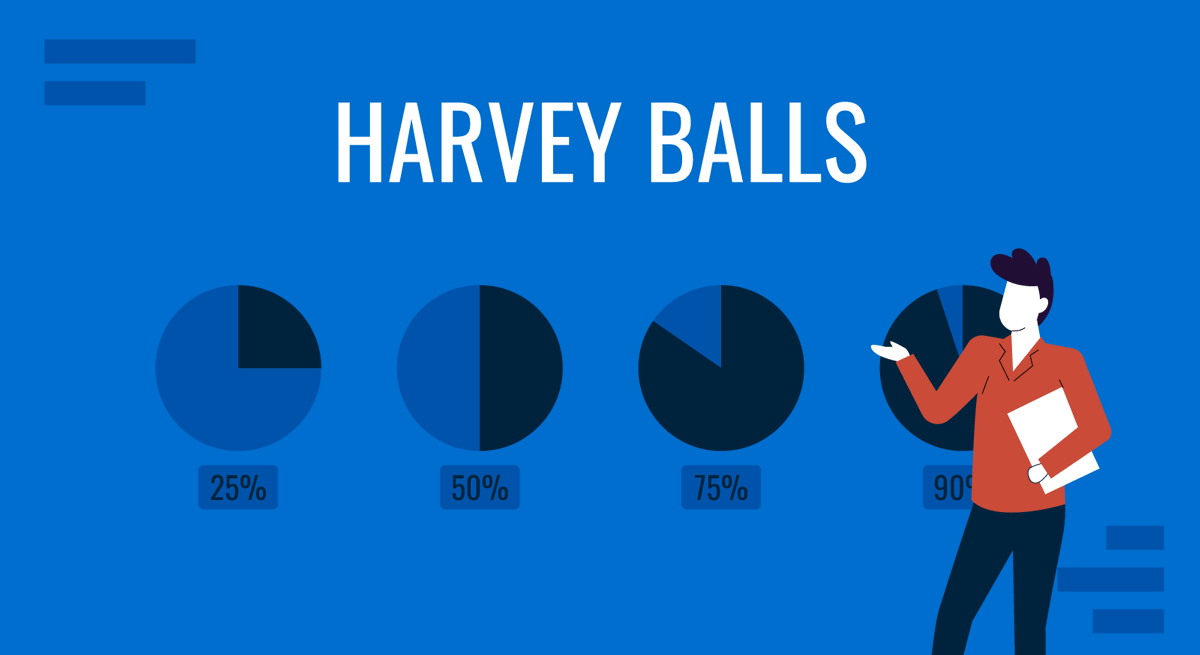
Harvey Balls are a type of state indicator commonly used for comparison in presentations and reports. These are ideograms for visual communication and representation of qualitative information. For example, Harvey Balls can be used to depict to what degree a specific item may meet the requirements of a criterion. You might find Harvey Balls in a number of comparison types, such as a comparison of a product by price, weight, quality, taste, safety, etc.
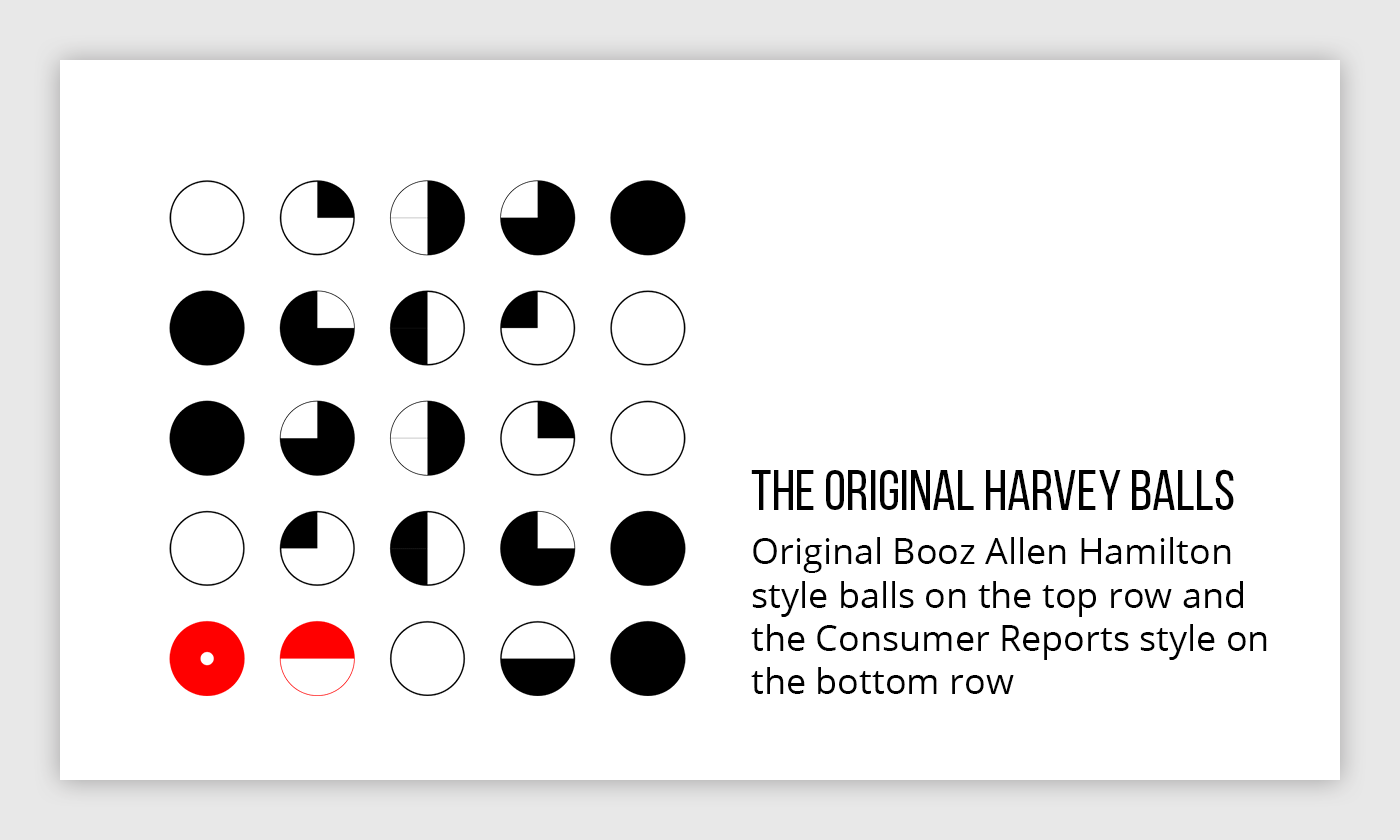
History of Harvey Balls
Harvey balls were the result of Harvey L. Poppel’s research. He is credited with inventing the ideograms during the 1970s. He was an IT investor and also served as the M.D. for an IT Mergers and Acquisitions firm by the name of Broadview Associates. Furthermore, he also worked at Booz, Allen, and Hamilton, Inc. (among his portfolio with other prestigious organizations). In turn, thanks to his time at Booz, Harvey Balls are also known as Booz Balls, a synonym that is very often used to refer to this type of ideogram, especially in Harvey Balls PPT presentations
Poppel developed the business use of Harvey Balls to prioritize and compare alternative sets. Over the years, Harvey balls have found their way into PowerPoint presentations in the form of clipart and tables offering a great visualization tool to better explain comparisons and trends.
Harvey Balls and Visual Communication
Harvey Balls (a.k.a. Booz Balls) serve as a means for visual communication, which is not just limited to business presentations but also has uses in other fields such as Astronomy, Meteorology, and Cartography. Harvey Balls are used for depicting visualizations related to the moon cycles and the weather. Of course, Harvey Balls have also evolved into various other uses. For example, IBM used Harvey Balls in its Lotus Notes software to show whether the recipient was copied, a sole recipient, etc.
With Booz Balls in your presentations, the audience can get a quick update at a glance, and then, if needed, go deeper to understand what is the exact value behind the visual representation.
Why Use Harvey Balls in Your PowerPoint Presentations?
Harvey Balls serve as a powerful visual aid in PowerPoint presentations for several compelling reasons:
- Clarity and Simplicity: Harvey Balls offers a straightforward and intuitive way to represent qualitative information. They simplify complex data and make it easy for your audience to grasp at a glance.
- Space Optimization: Instead of cluttering your slides with lengthy text or detailed tables, you can use Harvey Balls to condense information, saving valuable slide space. This leads to cleaner, more visually appealing presentations.
- Effective Comparison: Harvey Balls excels at visualizing comparisons, whether it’s comparing product attributes, project progress, or other qualitative factors. They allow your audience to quickly understand relative differences.
- Versatility: Beyond presentations, Harvey Balls finds applications in various fields, from project management to meteorology. They offer versatility in visual communication, making them suitable for diverse contexts.
- Professionalism: Incorporating Harvey Balls in your slides can elevate the professionalism of your presentation. They convey a structured and organized approach to data representation.
Tips to Make Your Harvey Balls Look Professional and Attractive
To ensure your Harvey Balls enhance your PowerPoint presentations effectively, consider these tips:
- Consistent Styling: Maintain a consistent style throughout your presentation. Use the same colors, shapes, and sizes for Harvey Balls to create a cohesive visual experience.
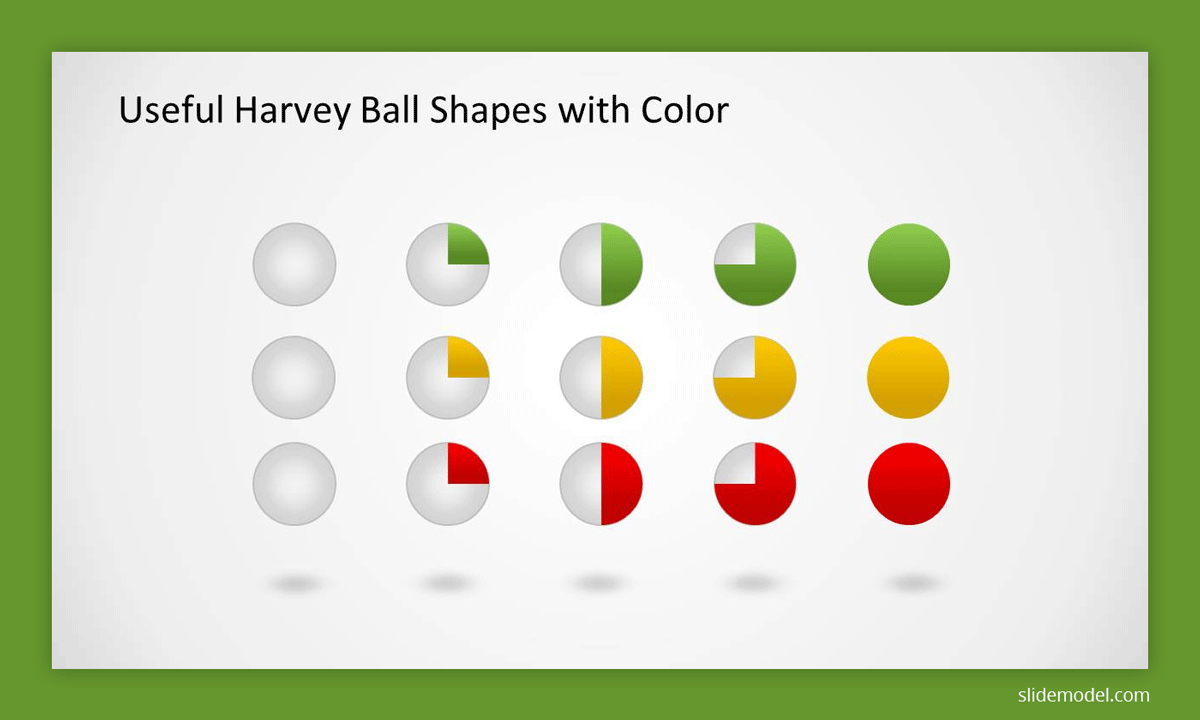
- Color Coding: Use color strategically to convey meaning. For example, use green for positive aspects and red for negative ones. Ensure the color scheme aligns with the context of your presentation.
- Clear Legends: If you’re using different Harvey Ball styles or colors to represent various attributes, include a legend or key to clarify their meanings. This prevents confusion among your audience.
- Appropriate Sizing: Ensure your Harvey Balls are appropriately sized for readability. Overly small or large Harvey Balls can hinder understanding. Consistent sizing also creates a more polished look.
- Balance and Alignment: Pay attention to the arrangement and alignment of your Harvey Balls. Maintain a neat and balanced layout to enhance the visual appeal of your slides.
- Use Tables: Consider placing Harvey Balls in well-structured tables. Tables provide a clear framework for organizing and comparing information, making it easier for your audience to follow.
- Limit Overuse: While Harvey Balls are useful, avoid overloading your slides with them. Use them selectively to highlight key points and avoid overwhelming your audience with visuals.
- Practice Moderation with Color: Be cautious when using multiple colors in a single visualization. Too many colors can be distracting and confusing. Stick to a limited, harmonious color palette.
- Accessibility: Keep accessibility in mind. Ensure that your Harvey Balls are discernible by individuals with color vision deficiencies. Use color combinations that are legible for all viewers.
- Professional Templates: Consider using professionally designed PowerPoint templates that incorporate Harvey Balls. Templates save time and often come with well-thought-out visual elements.
Pros and Cons of Using Harvey Balls
There can be many advantages and disadvantages of using Harvey Balls in PowerPoint Presentations and other types of documentation. Let’s take a look at some of the pros and cons of using Harvey Balls.
Pros of Using Harvey Balls in your Presentations
Harvey Balls can Help Depict Qualitative Information: Shaded Harvey Balls can help to instantly visualize how much or how less of an item is to be considered against another. Similarly, using images instead of digits can be helpful for an audience, who might find large chunks of information confusing.
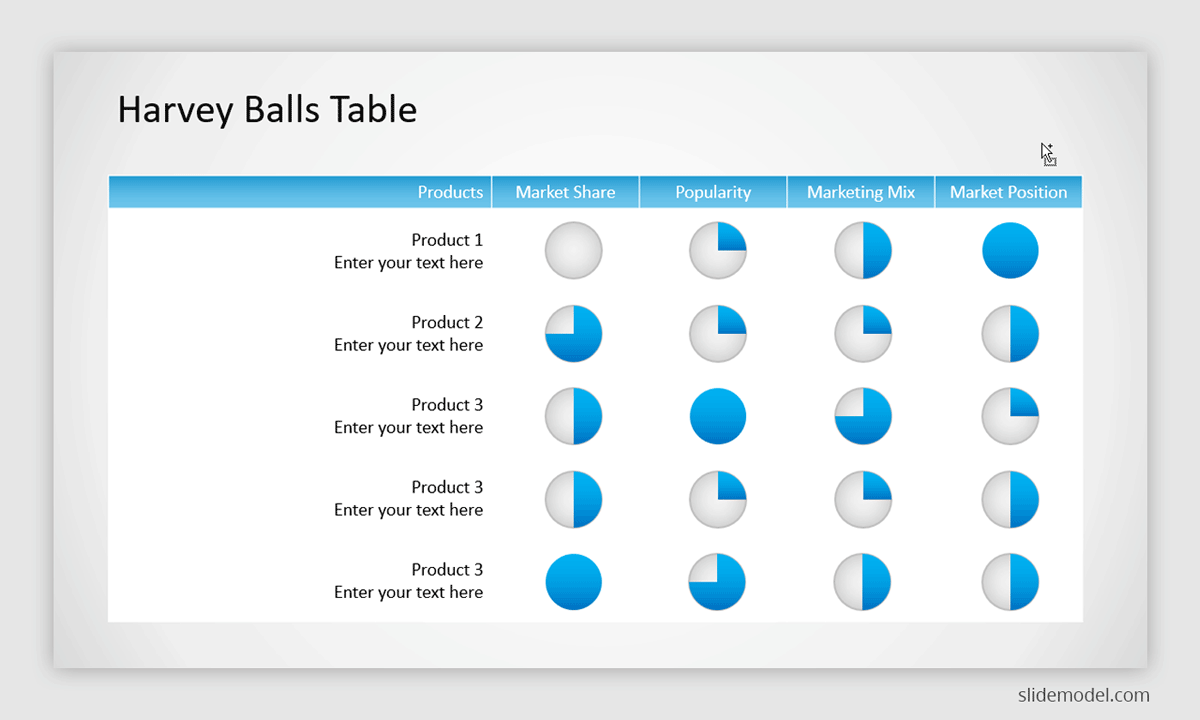
Harvey Balls can Save Space on a Slide: Instead of using large chunks of data, you can shrink the information by using Harvey Balls. For example, if you intend to compare two items in terms of safety, quality, or market share, you can simply use Harvey Balls for a quick visual scan in the form of a Harvey Balls table. This can save space on a slide, which otherwise might require bits of detailed information and trends associated with the products in question. Instead of going into too many details, a Harvey Balls table can present a more concise comparison.
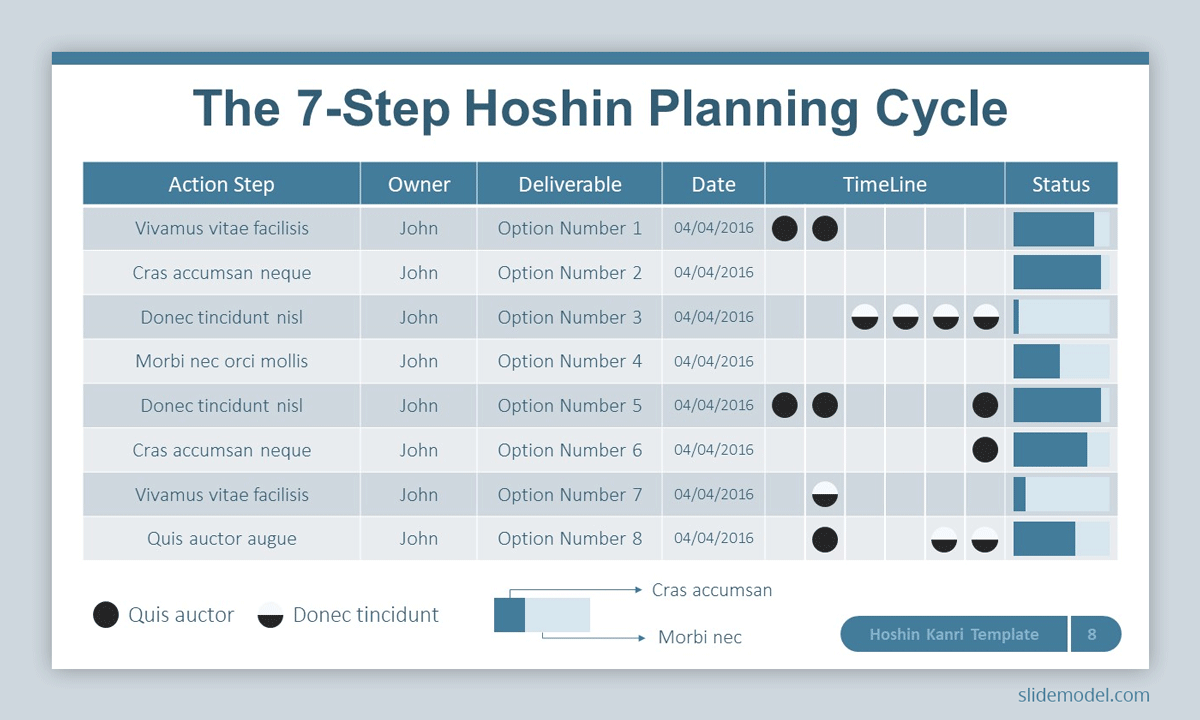
Harvey Balls can be useful in Reports: Slides that usually bear an intense amount of data, such as reports, can be trimmed to the essential information required to disclose by applying the Harvey Balls. In turn, viewers can associate ideas with different areas of the report due to the intense graphical usage, which helps to increase the retention rate.
Useful for Project Tracking and Other Purposes: Harvey Balls are also used for project tracking in project management, as well as in value-stream mapping, lean manufacturing, Astronomy, Meteorology, and Cartography. You can also use Harvey Balls for various other purposes that you can think of by incorporating them into desktop and mobile applications, games, and websites.
Cons of Using Harvey Balls
Not very Commonly Used: Unlike some other famous symbols such as emojis, stars (used for in ratings), the infamous question mark, or other famous visualizations, Harvey Balls are not as universal as one might think. Across different cultures, especially ones not influenced by a lot of Western symbols, Harvey Balls might be less known and, therefore, might be counterproductive to use in presentations, reports, etc.
Can be Visually Overpowering: While Harvey Balls can be easy to grasp for many people, some will always find them confusing and even visually overpowering. This is especially true when you might use them with various colors in the same visualization. For example, a table with colorful Harvey Balls can be confusing, unlike a simple pie chart that might be easier to grasp based on the key given for the chart.
Other Universal Symbols Might be Easier to Understand: You might create a table with Harvey Balls depicting the quality of a product or might simply use a 5-star rating mechanism by which two products are given stars based on their quality. The latter, for some, might be easier to grasp instead of a shaded ball. For example, it can be easy to understand that Product A, with a 4-star rating, is better in quality than Product B, with a 2-star rating. This, when compared to shaded Harvey Balls, would be far easier to understand.
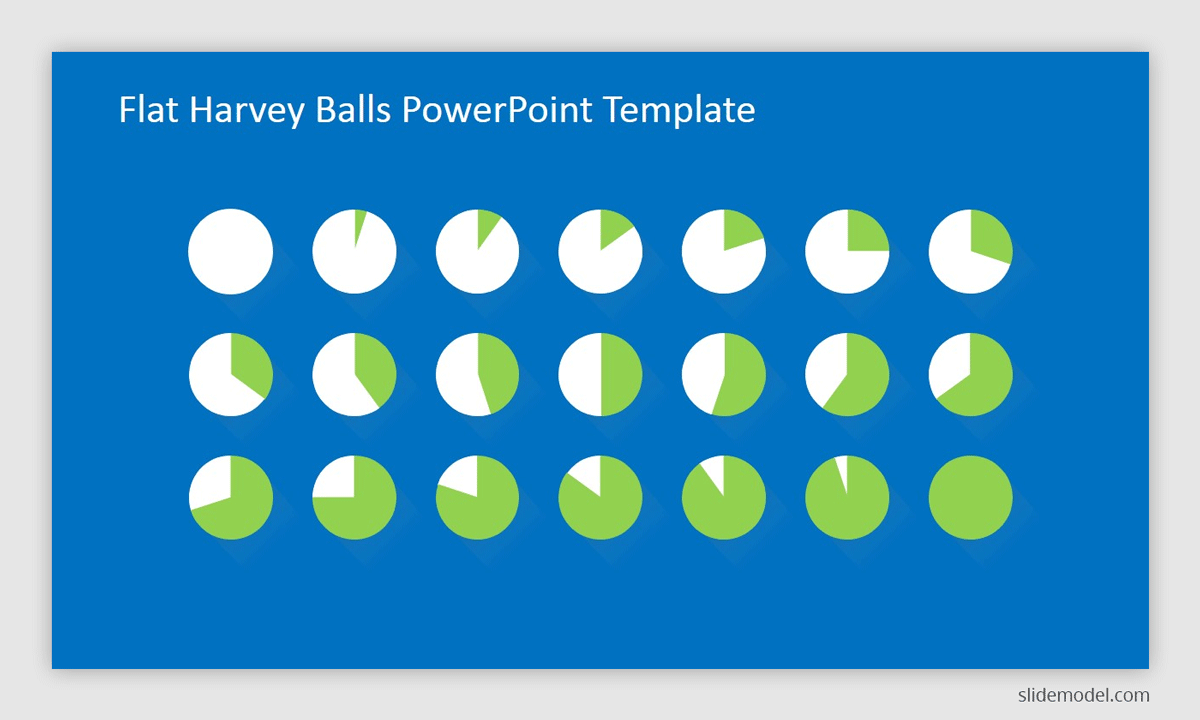
Source: Flat Harvey Ball PowerPoint Template – SlideModel
How to create Harvey Balls in PowerPoint?
In this mini-tutorial, we will give you step-by-step instructions on how to make Harvey Balls in PowerPoint and how to create and customize your own Harvey Balls. This way, you can use them to make professional and impactful presentation infographics, reports, and dashboards.
Step 1 – Create the Shapes
In the main menu, locate the option: Insert > Shapes > Basic Shapes > Oval Shape. You must press CTRL + Shift to create an asymmetric circle of the size you need. Once you have created it you can duplicate (CTRL-D) it to create several Harvey balls for PowerPoint at once.
Step 2 – Cut out the circles
Once you have created your circle shapes in your presentation, you must cut them out to shape them into Harvey Balls. Select the shape and click on Format tab > Edit Shapes > Change Shape > Pie chart.
Step 3 – Shaping the Harvey Balls
Once you have the Pie Chart shape ready, if you left-click on the shape, you can modify its angle in order to create the different Harvey Balls shapes.
Step 4 – Customize the Harvey Balls
Right-click on the shape and select “Fill” or “No Fill”; this way, you can color the shape as per your needs.
Congratulations. Following these steps, we have created the first Harvey Balls for PowerPoint and now we can use them in PowerPoint presentations (or even in Google Slides) to present reports and provide qualitative information in a quantitative way.
If you don’t have the time to create a Harvey Ball graphic from scratch, you can reuse some of our pre-designed Harvey Balls templates, which are ready for Microsoft PowerPoint and Google Slides. We recommend using pre-designed Harvey Balls PowerPoint templates if you want to reduce the effort and time involved in creating a presentation from scratch or learn how to insert Harvey Balls in PPT effectively.
Harvey Ball PowerPoint Templates
If you want to create presentations with Harvey Balls minus all the effort of creating them from scratch, we have some awesome templates that can help you create tables, infographics, and other types of visualizations using Harvey Balls.
Source: Colorful Harvey Balls PowerPoint Template – SlideModel
How to Insert Harvey Balls in PowerPoint (Easy Ways)
Inserting Harvey Balls from Templates
A possible option to insert Harvey Balls in PowerPoint is reusing our Harvey Balls PowerPoint templates. As a subscriber, you will get access to our entire catalog of PowerPoint templates where you can download the pre-designed Harvey Balls.
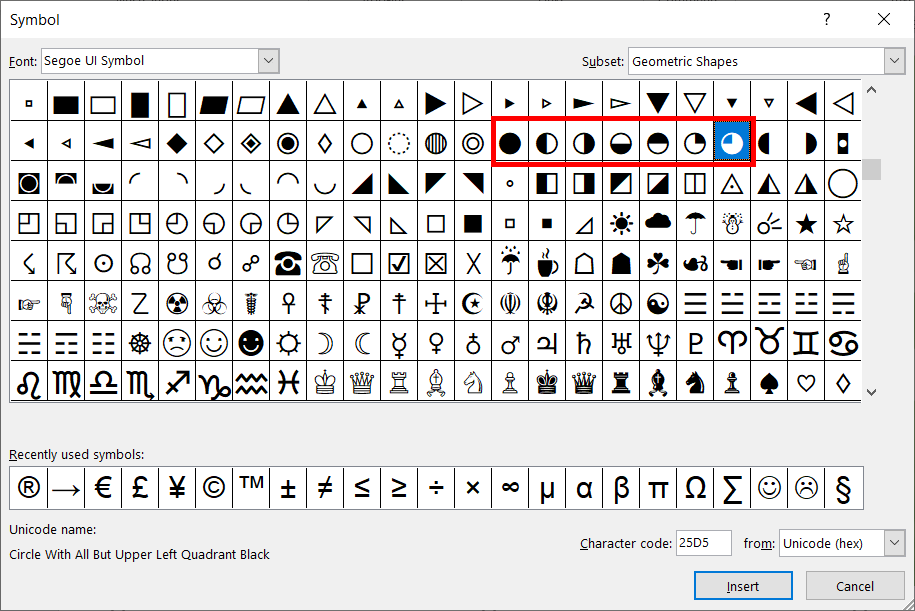
Using Harvey Ball Symbols in PowerPoint (with Character Map)
Another option to insert Harvey Balls in PowerPoint is using the character map dialog to insert a Harvey Ball Symbol. This can be inserted in a text shape or a table cell so having the cursor in any of these placements, go to Insert -> Symbol, then choose Segoe UI Symbol and look for the Harvey Ball symbols as shown in the screenshot below. The same approach works if you need to insert Harvey Balls in a Microsoft Excel spreadsheet.
Harvey Balls Alternatives for Presenters
If you’re looking for an alternative to Harvey Balls, here are a few ideas for your next PowerPoint presentation.
PowerPoint Charts
While Harvey Balls can be quite useful for visually representing information, sometimes it is easier to simply use a PowerPoint Chart. A simple pie or bar chart might be easier to understand for an audience than a number of shaded balls in the form of a table. Moreover, reading through a color-coded key for a chart can be easier as compared to colored Harvey Balls. If you’re looking for an alternative to Harvey Balls, why not simply use a good old PowerPoint chart? If the requirement is to reduce space and want to show a trend over a period of time, Tufte’s sparkline charts can be useful. Another option could be to use bullet graphs.
SmartArt Graphics
SmartArt Graphics is a smart way of creating visualizations in PowerPoint. With the aid of easy-to-edit layouts, you can create anything from a list, process, cycle, or comparison to a hierarchy, matrix, pyramid, etc.
PowerPoint Shapes
You can get a little creative and use PowerPoint Shapes instead of Harvey balls by shading them using tools from the Draw tab in PowerPoint. You can shade various shapes such as triangles, squares, rectangles, etc. Alternatively, you can also use clipart and images for the purpose. Another idea would be to use spots and rings on tables.
PowerPoint Icons
If you’re an Office 365 user, you can also use PowerPoint Icons via the Insert tab to include a plethora of presentation icons for creating anything from tables and infographics to complex PowerPoint layouts.
These icons are available as Scalable Vector Graphics (SVG) files, which means that you can use these icons without worrying about loss of quality.
You can expand or contract these icons using drag and drop, as well as use different colors and adjust them across your PowerPoint layouts with ease. The icons set offered by Office 365 contain various universally recognized symbols, which can help you make use of icons for explaining data, trends, ideas, and concepts.
The icons come in various categories, including accessibility, analytics, animals, apparel, arrows, arts, body parts, bugs, business, celebration, commerce, signs and symbols, sports, technology and electronics, tools and buildings, vehicles, weather and seasons, etc.
Alternatively, you can also try SlideModel Icons, our solution to help you finding symbols & icons for presentations. By using SlideModel Icons, available on certain plans, you can browse and download scalable icons for PowerPoint & Google Slides presentations.
Infographic PowerPoint Templates
You can also use Infographic PowerPoint Templates which are meant for creating infographics with the help of ready-made layouts. We have singled out a few such templates for you that you can use to easily create infographics in PowerPoint.
Final Words
Harvey Balls are an excellent resource for making visualizations in PowerPoint, for tracking projects, lean manufacturing, Astronomy, Meteorology, Cartography, and even official reports. You can also find various creative uses for Harvey Balls in your day-to-day projects, whether they are related to your office, school, or an independent project that you may be working on. Whether you’re a software developer, business professional, or someone looking to create a presentation to show data and trends, Harvey Balls in PowerPoint can help make your job easier, as well as add some visual appeal to your presentations. However, when using Harvey Balls, it is recommended not to overuse them or mix them with too many icons and symbols.
What makes Harvey Balls easy to understand is, arguably, their simplicity in representing qualitative information. You wouldn’t want to defeat that very purpose by using Harvey Balls to create a confusing slide deck which might leave an audience confused and unable to grasp the very content you are trying to explain within a short period of time. If you believe you are not very good at using colors in visualizations, you can use professionally made presentation templates with Harvey Balls to ensure that the colors are well-matched and suitable for explaining the content that you’re looking to address. You can also opt for a single or two colors for your layouts made up of Harvey Balls.
1. Flat Harvey Ball PowerPoint Template
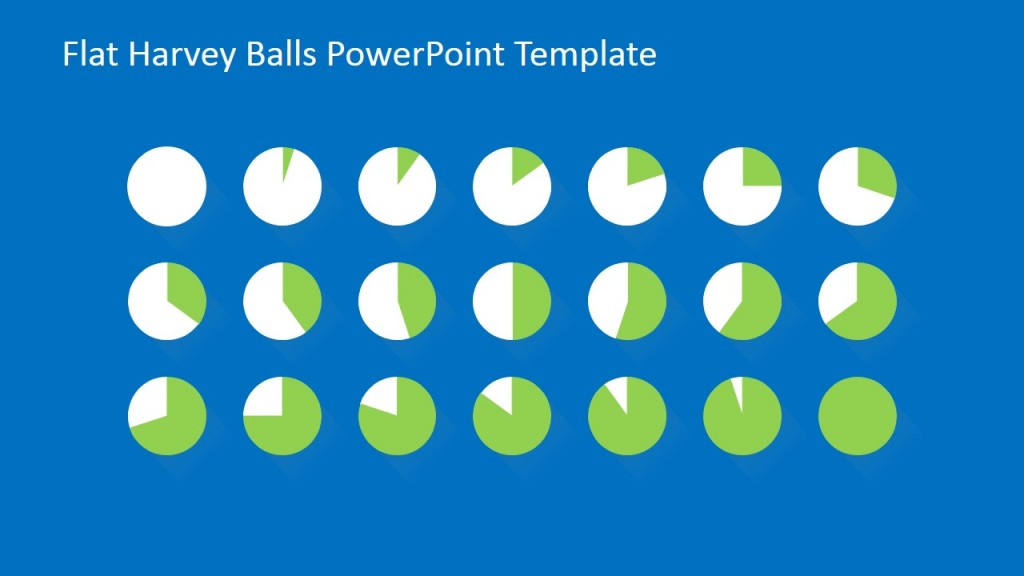
The Flat Harvey Ball PowerPoint Template is a presentation that contains 21 examples of Harvey Balls with different shapes to use in your reports. At the same time, it contains different slides in which you can add detailed and specific information about each Harvey Ball you want to present.
2. Thin Harvey Balls Toolkit PowerPoint Template
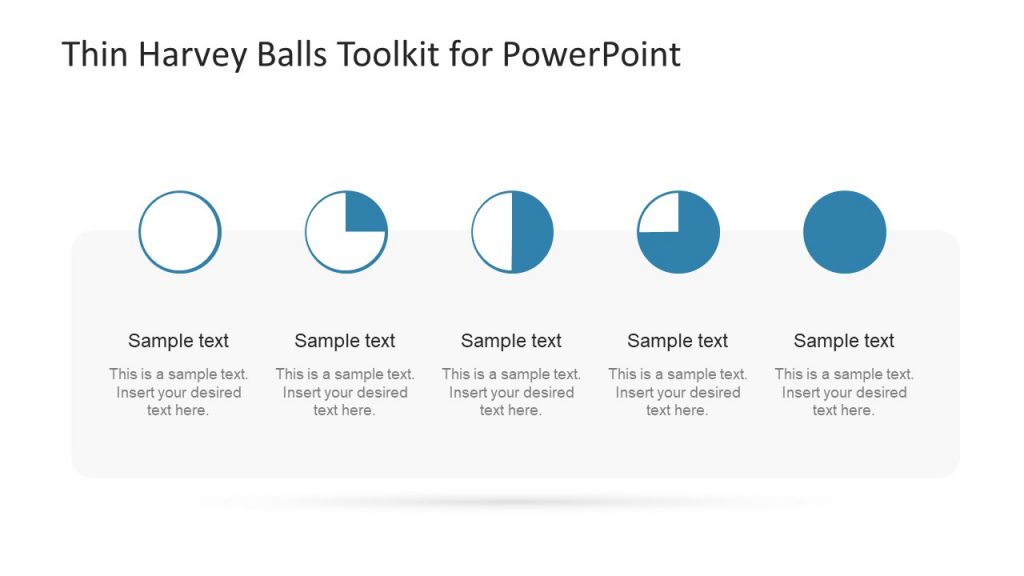
The Thin Harvey Balls Toolkit PowerPoint Template is an even more complete Harvey Balls presentation option. It allows you to generate a descriptive table about each type of Harvey Balls, present them one by one to provide more information and details, and in turn, present the Harvey Balls on a world map in order to provide general information about each continent.
3. 3×3 Diagram for PowerPoint with Harvey Balls
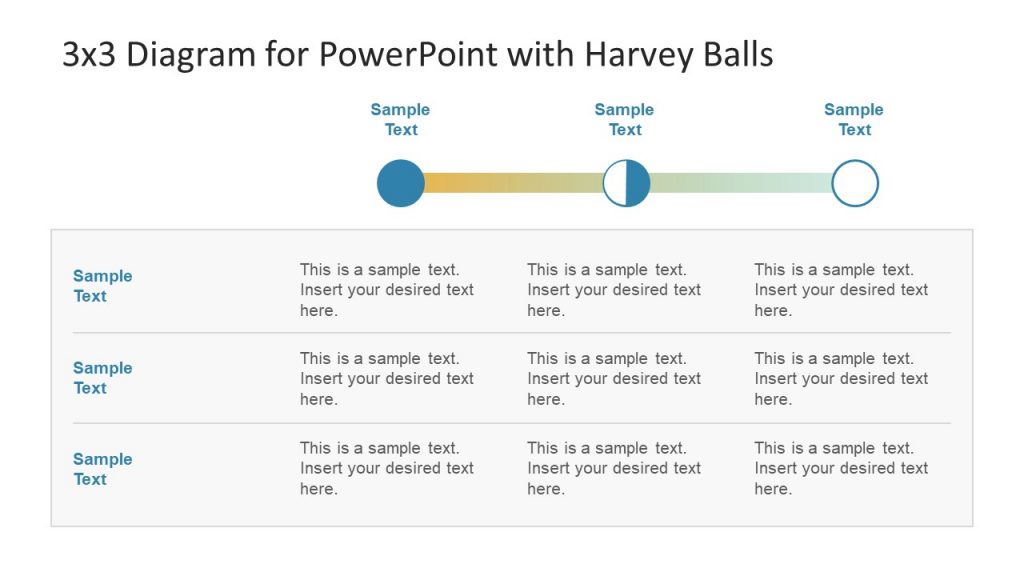
In the 3×3 Diagram for PowerPoint with Harvey Balls, you will be able to present qualitative information in a quantitative way. Thanks to its design with a 3×3 diagram you will have the possibility to add specific information about each one of the Harvey Balls and give a professional design to your presentation.
4. Tables with Symbols for PowerPoint

In Tables with Symbols for PowerPoint, you can use a 5×5 diagram to add different points to take into account in your report and their respective Harvey Balls to provide a quantitative indicator.
5. Benchmarking PowerPoint Template
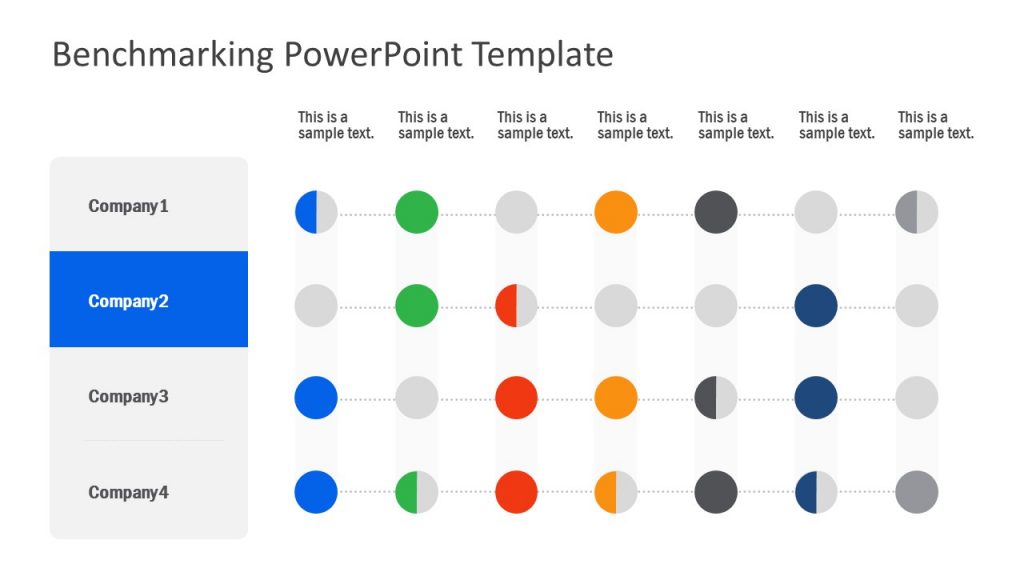
If you are looking to generate a Benchmark report that presents different companies, the Benchmarking PowerPoint Template is what you need. Thanks to its design you will be able to present 4 different companies and different study points which are measured through Harvey Balls.
6. 3D Sliced Spheres for PowerPoint
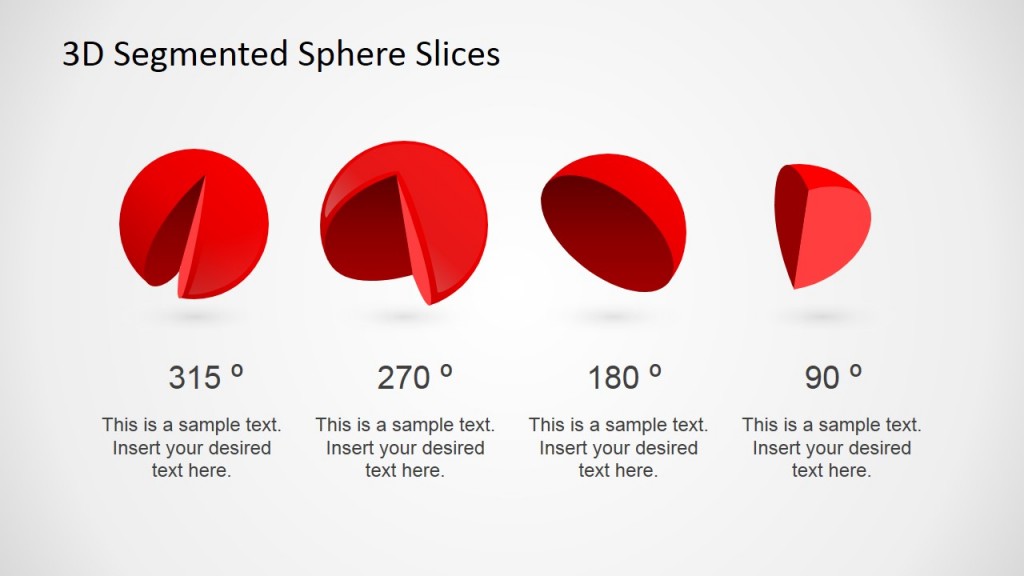
The 3D Sliced Spheres for PowerPoint allows you to generate a different and more aesthetic design on Harvey Balls. Thanks to this PowerPoint Template you will be able to present your Harvey Balls in 3D format, in order to generate more engagement with your audience.
7. Harvey Ball Shapes for PowerPoint
Harvey Ball Shapes for PowerPoint is a simple design but one of the most complete. Within its slides you can find different shapes of Harvey Balls to use in your reports and comparison charts of different sizes to add even more information to your presentations.