Slide 3 of 15 from Survey Presentation Template
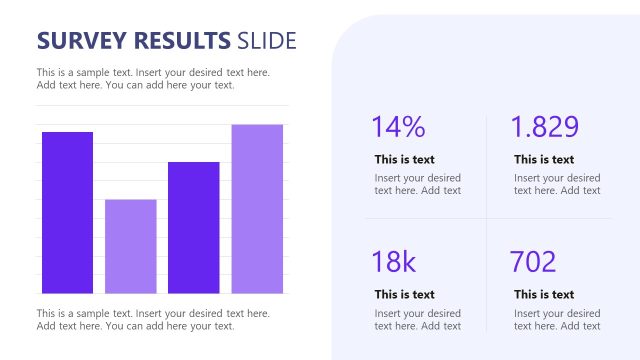
Survey Results Slide with Four Segments & Pie Chart
Survey Results Display for Presentations
- Chart
- Pie Chart
- Evaluation Slide
- 16:9
- 100% Editable
The Survey Results Display slide from the Survey Presentation Template offers a structured layout with four circular charts to visualize survey percentages effectively. This design supports clear comparison of multiple data points, making it suitable for business presentations and academic reports. The editable slides include placeholders for descriptive text, enhancing clarity in summarizing findings within a corporate presentation or pitch deck template.
What’s on This Slide
The layout features four circular charts arranged in a 2x2 grid. Each chart displays a percentage value and is accompanied by a placeholder for descriptive text. The first chart is positioned at the top left, followed by the second chart at the top right. The third chart is located at the bottom left, with the fourth chart at the bottom right. Each chart is visually distinct, using a purple and white color scheme, with the percentage values prominently displayed. Text placeholders are aligned below each chart, maintaining a consistent format.
How to Use It
This layout serves to present survey results in a clear, comparative format. It is suitable for displaying multiple data points side by side, allowing for easy visual analysis. This slide fits well in a presentation sequence after introducing survey objectives and before discussing detailed findings. It is ideal for researchers and analysts who need to summarize survey data effectively, making it useful in business meetings and academic settings.
Text Placeholders & Capacity
Keep your copy within these limits so it fits without resizing. Each node can hold a title and a brief description, roughly 20 and 50 characters respectively.
| Placeholder | Count | Max characters (approx.) |
|---|---|---|
| Item heading | 4 | 20 |
| Item body | 4 | 50 |
Slide Keywords
Download unlimited PowerPoint templates, charts and graphics for your presentations with our annual plan.
DOWNLOADReturn to Survey Presentation Template.