Slide 7 of 15 from Survey Presentation Template
Three Donut Charts for Data Display – Survey Presentation Template
Survey Results Slide for Presentations
- Chart
- Pie Chart
- Evaluation Slide
- 16:9
- 100% Editable
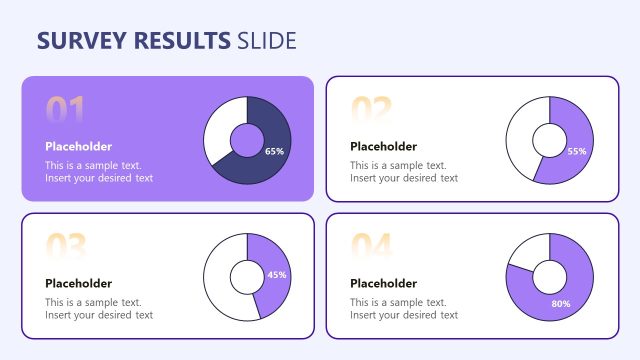
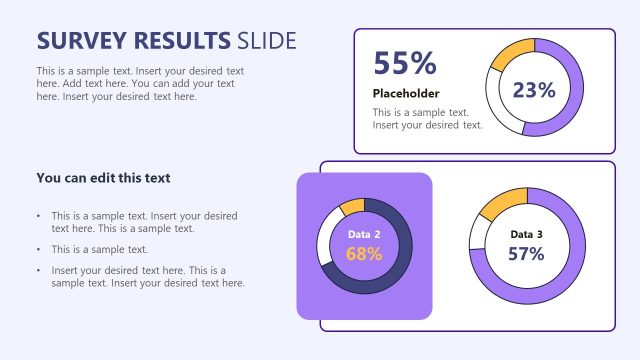
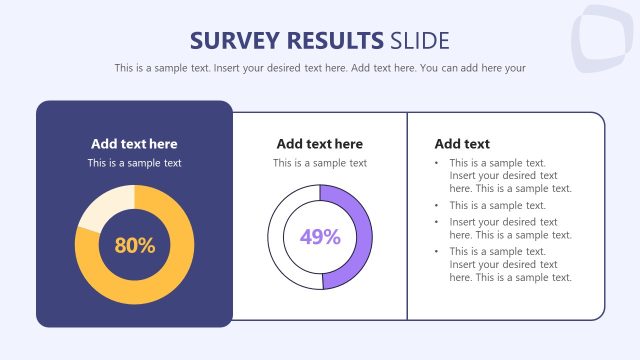
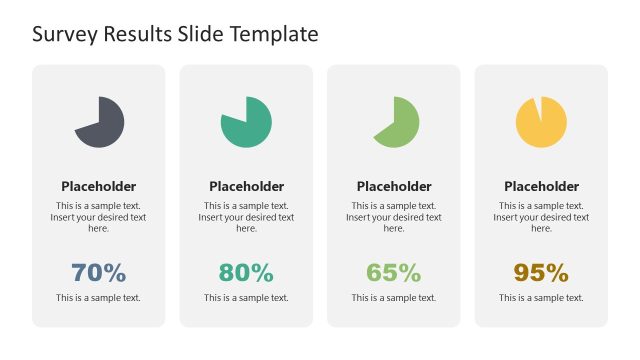
The Survey Results Slide from the Survey Presentation Template offers a clear visualization of statistical data using three pie charts, ideal for business presentations and research reports. This slide layout supports effective communication of survey findings through editable shapes and text placeholders, enhancing any corporate presentation or pitch deck template with precise data representation.
What’s on This Slide
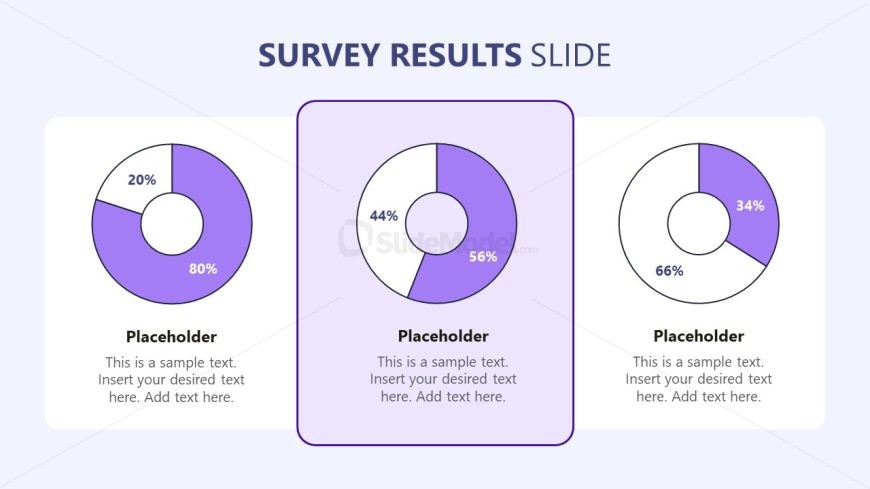
The layout features three circular pie charts aligned horizontally, each displaying percentage values. The leftmost chart shows segments of 20% and 80%, the center chart shows 44% and 56%, and the rightmost chart shows 34% and 66%. Each chart has a corresponding text placeholder below it, centrally aligned, allowing for descriptive text. The background is a light gradient, enhancing the visual appeal. The charts are evenly spaced, with a consistent design, and the overall composition is balanced and organized, focusing on data representation.
How to Use It
This layout serves to present survey results visually, making it suitable for data-driven presentations. It fits well after an introduction to survey findings, helping to summarize key data points. This slide is ideal for researchers and analysts who need to convey statistical insights clearly. It can be used in business meetings, academic presentations, or marketing reports to highlight survey outcomes effectively.
Text Placeholders & Capacity
Keep your copy within these limits so it fits without resizing. Node body slots can accommodate about 15-20 words each.
| Placeholder | Count | Max characters (approx.) |
|---|---|---|
| Item heading | 3 | 15 |
| Item body | 3 | 100 |
Slide Keywords
Download unlimited PowerPoint templates, charts and graphics for your presentations with our annual plan.
DOWNLOADReturn to Survey Presentation Template.