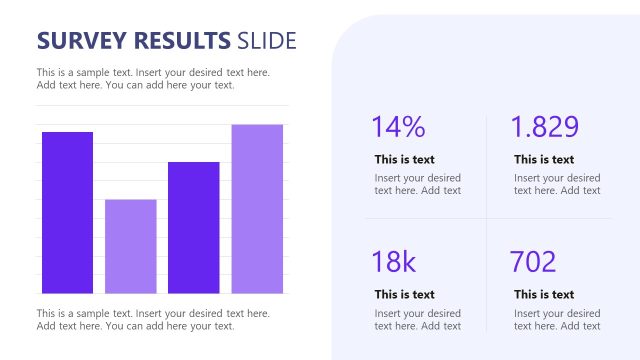
Slide 8 of 15 from Survey Presentation Template
Survey Presentation Template with Bar Chart
Survey Results Bar Chart Slide
- Chart
- Bar Horizontal
- Evaluation Slide
- 16:9
- 100% Editable
The Survey Results Bar Chart slide from the Survey Presentation Template offers a clear way to compare survey data using side-by-side horizontal bar charts. This layout is ideal for business presentations requiring visual evaluation of key metrics, providing editable slides that enhance data clarity and support effective communication of survey findings.
What’s on This Slide
The layout features two vertical bar charts positioned side by side. The left chart displays four horizontal bars with percentages labeled from top to bottom, each bar filled in shades of purple. The right chart mirrors this with four corresponding bars, also labeled with percentages, in varying shades of blue. Below each chart, there are text placeholders for additional commentary, aligned centrally. The overall composition is balanced, with a clear visual hierarchy emphasizing the percentage values. The background is light, enhancing the visibility of the charts.
How to Use It
This layout serves to present survey results in a comparative format, ideal for highlighting key findings. It fits within a presentation sequence after data collection and analysis slides, effectively summarizing insights. This structure is suitable for business contexts where survey data needs to be communicated clearly, such as marketing research, customer feedback analysis, or employee satisfaction surveys. It allows for easy visual comparison between different survey questions or demographics.
Text Placeholders & Capacity
Keep your copy within these limits so it fits without resizing. Body slots can accommodate roughly 20-25 words each.
| Placeholder | Count | Max characters (approx.) |
|---|---|---|
| Chart title | 1 | 30 |
| Item heading | 4 | 10 |
| Item body | 4 | 10 |
| Body paragraph | 2 | 150 |
Slide Keywords
Download unlimited PowerPoint templates, charts and graphics for your presentations with our annual plan.
DOWNLOADReturn to Survey Presentation Template.