Slide 10 of 15 from Survey Presentation Template
Segmented Survey Results Presentation Slide with Pie Charts
Survey Results Slide for Presentations
- Chart
- Pie Chart
- Evaluation Slide
- 16:9
- 100% Editable
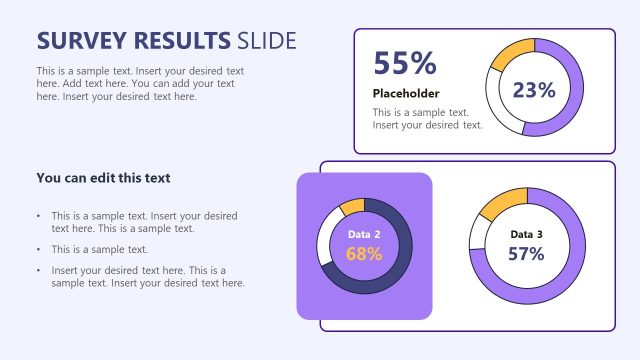
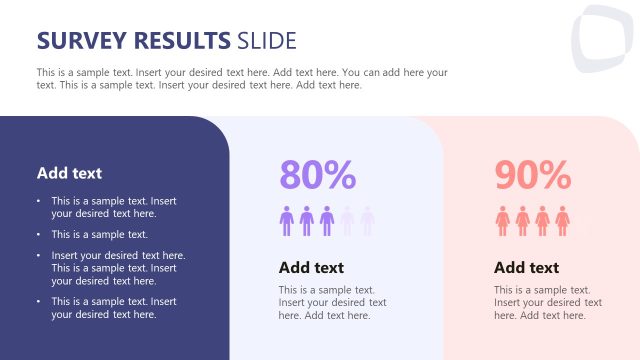
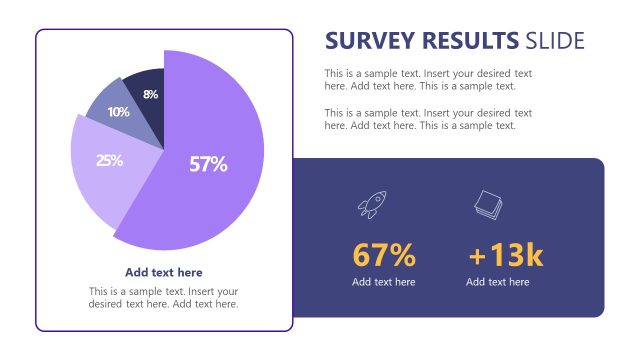
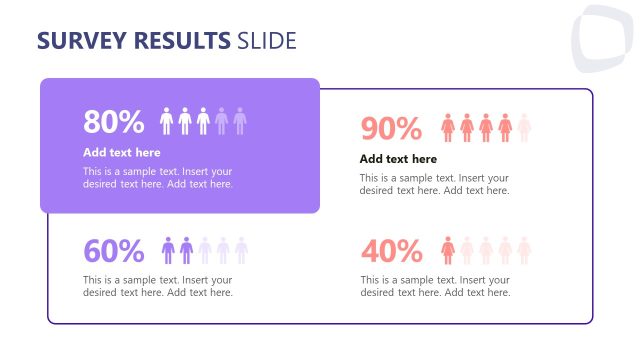
The Survey Results with Percentages slide from the Survey Presentation Template offers a clear layout to compare key survey metrics using circular charts. This slide design supports business presentations by visually summarizing contrasting data points, making it useful for market research or customer feedback reports. Its editable shapes and balanced composition enhance clarity in corporate presentations and pitch deck templates, ensuring effective communication of evaluation results.
What’s on This Slide
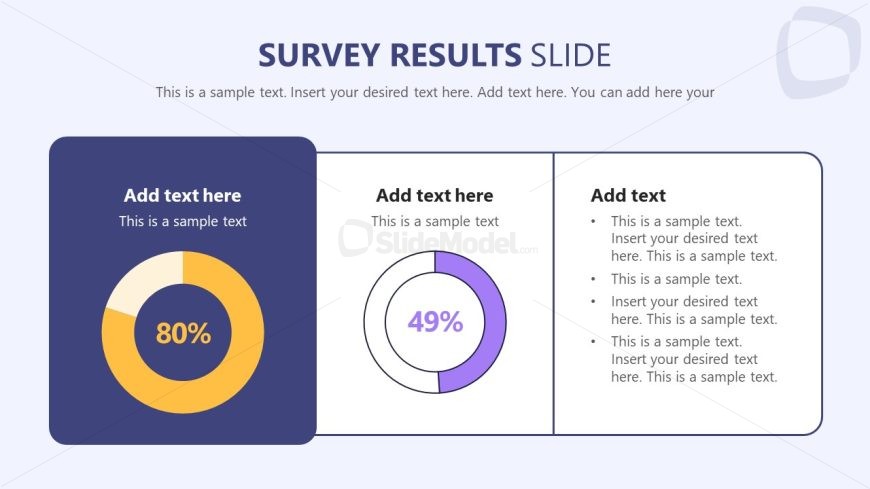
The layout features a left-aligned circular chart displaying an 80% value, accompanied by a right-aligned circular chart showing a 49% value. Both charts are set against a light background with a subtle gradient. Text placeholders are positioned above and below the charts, with the left section containing a title and a body text area, while the right section includes a title and a bullet-point list. The overall composition is balanced, with clear visual separation between the two sections. Color schemes include dark blue for the left section and light purple for the right.
How to Use It
This layout serves to present survey results effectively, showcasing key metrics visually through circular charts. It fits well in the middle of a presentation, following an introduction and preceding detailed analysis. Ideal for business contexts, it can be used to summarize findings from market research, customer feedback, or employee surveys. The structure allows for easy comparison of two distinct data points, making it suitable for highlighting contrasting results or trends.
Text Placeholders & Capacity
Keep your copy within these limits so it fits without resizing. Body slots can accommodate around 40-50 words each.
| Placeholder | Count | Max characters (approx.) |
|---|---|---|
| Slide title | 1 | 30 |
| Item heading | 2 | 10 |
| Item body | 2 | 50 |
| Body paragraph | 1 | 200 |
Slide Keywords
Download unlimited PowerPoint templates, charts and graphics for your presentations with our annual plan.
DOWNLOADReturn to Survey Presentation Template.