Slide 2 of 15 from Survey Presentation Template
Bar Chart Slide for Survey Results Discussion
Survey Results Slide for Presentations
- Chart
- Bar Vertical
- Evaluation Slide
- 16:9
- 100% Editable
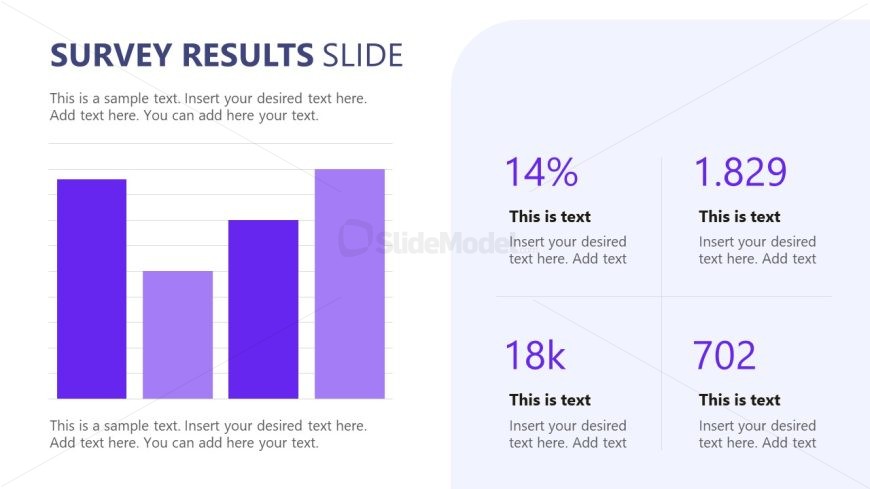
The Survey Results Slide from the Survey Presentation Template offers a clear layout for presenting market research data using editable slides. Featuring a vertical bar chart alongside text placeholders, this slide supports effective communication of customer feedback and academic survey findings in business presentations or pitch decks.
What’s on This Slide
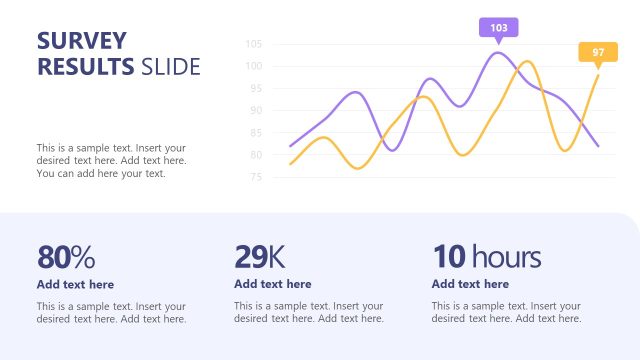
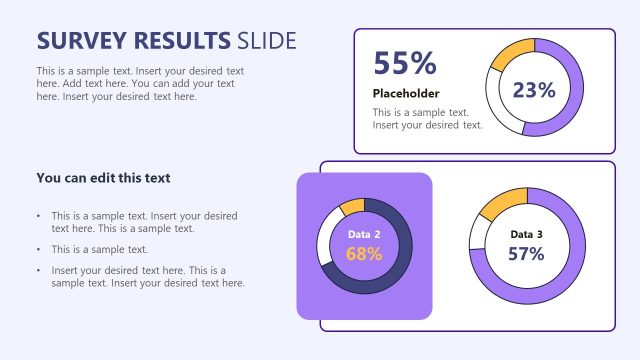
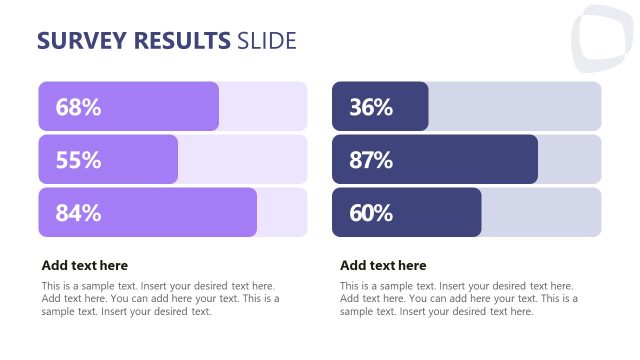
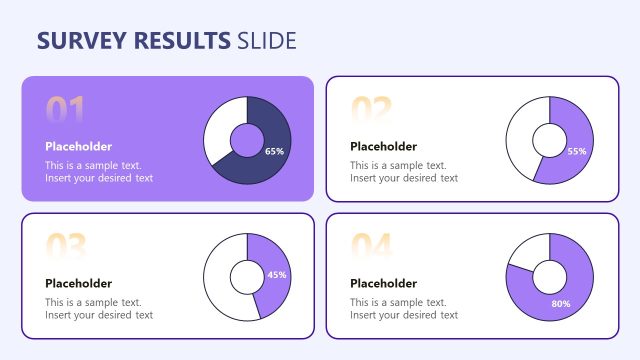
The layout features a bar chart on the left, displaying survey results with four vertical bars of varying heights, indicating different data points. To the right, there are four text placeholders arranged in two rows. The first row contains a percentage and a numerical value, while the second row includes another percentage and a numerical value. Each placeholder is aligned to the right of the chart. The background is light with a subtle gradient, and the overall color scheme includes shades of purple for the bars. The visual hierarchy emphasizes the bar chart as the primary focus.
How to Use It
This layout serves to present survey results clearly, making it suitable for data-driven presentations. It fits well after an introduction slide, providing a visual summary of findings. This slide can be used in business contexts such as market research reports, customer feedback analysis, or academic presentations. It effectively communicates quantitative data alongside qualitative insights, making it versatile for various audiences.
Text Placeholders & Capacity
Keep your copy within these limits so it fits without resizing. Node labels can hold short phrases, while body text slots can accommodate several sentences.
| Placeholder | Count | Max characters (approx.) |
|---|---|---|
| Chart title | 1 | 30 |
| Item heading | 4 | 10 |
| Item body | 4 | 15 |
| Body paragraph | 3 | 50 |
Slide Keywords
Download unlimited PowerPoint templates, charts and graphics for your presentations with our annual plan.
DOWNLOADReturn to Survey Presentation Template.