Slide 11 of 15 from Survey Presentation Template
3D Pie Chart Diagram – Survey Results PPT Template
Survey Results Presentation Slide
- Chart
- Pie Chart
- Evaluation Slide
- 16:9
- 100% Editable
The Survey Results Slide from the Survey Presentation Template offers a clear layout to display survey findings using a pie chart and accompanying text. This slide template is ideal for business presentations that require concise reporting of customer feedback or market research data. Its design supports easy comparison of data points and integrates well within a professional slide deck, utilizing editable shapes and vector icons for customization.
What’s on This Slide
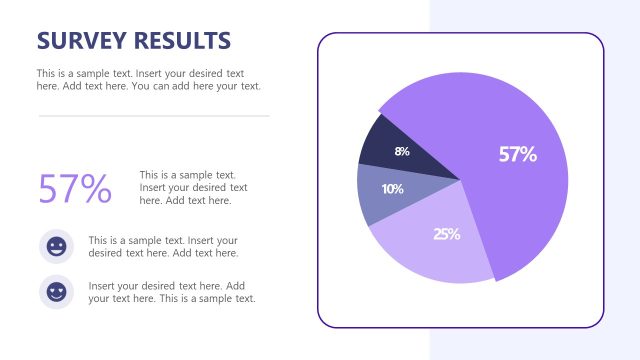
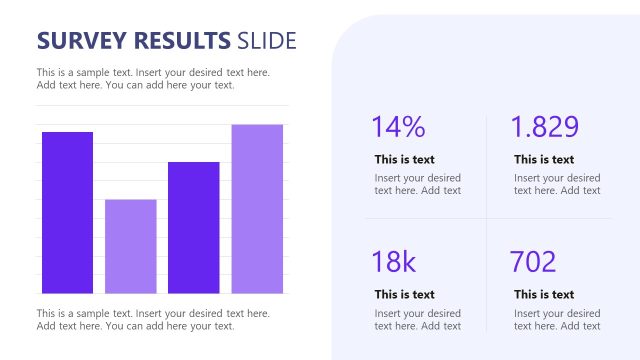
The slide features a pie chart on the left side, displaying segments with percentages: 57%, 25%, 10%, 8%. The chart is visually prominent, with a purple color scheme. To the right, there is a rectangular area containing a title labeled 'SURVEY RESULTS SLIDE' at the top. Below the title, there are three text placeholders arranged vertically, with the first two having sample text and the last one labeled with a percentage (67%) and a number (+13k). The overall layout is balanced, with clear visual hierarchy and spacing between elements.
How to Use It
This layout serves to present survey results effectively, combining visual data representation with textual explanations. It fits well in a presentation sequence after a problem or introduction slide, providing a clear summary of findings. Suitable for business contexts, it can be used to report survey outcomes, customer feedback, or market research insights. The layout allows for easy comparison of data points while providing space for additional commentary or analysis.
Text Placeholders & Capacity
Keep your copy within these limits so it fits without resizing. Body slots can accommodate roughly 3-4 words each.
| Placeholder | Count | Max characters (approx.) |
|---|---|---|
| Slide title | 1 | 30 |
| Item body | 4 | 20 |
| Item heading | 1 | 5 |
Slide Keywords
Download unlimited PowerPoint templates, charts and graphics for your presentations with our annual plan.
DOWNLOADReturn to Survey Presentation Template.