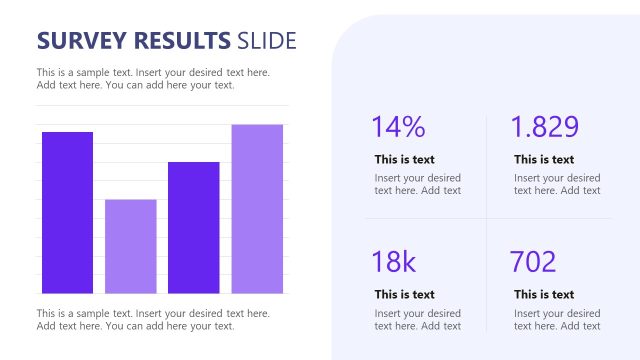
Slide 5 of 15 from Survey Presentation Template
Donut Charts Slide for Survey Results Template
Survey Results Presentation Slide
- Chart
- Pie Chart
- Data Analysis Slide
- 16:9
- 100% Editable
The Survey Results Slide from the Survey Presentation Template offers a clear data visualization layout with pie charts and editable shapes, ideal for business presentations and market research reports. This slide template supports effective communication of survey findings within a corporate presentation or pitch deck template, enhancing audience understanding through well-structured PowerPoint slides and Google Slides templates.
What’s on This Slide
The layout features a light purple background with a title at the top left, stating 'SURVEY RESULTS SLIDE.' Below the title, there are two large circular charts on the right side, displaying percentages. The first chart shows 55% and 23%, while the second chart indicates 68% and 57%. Text placeholders are present beneath the title and to the left of the charts, with bullet points for additional information. The visual hierarchy emphasizes the charts, with the title and placeholders supporting the data presentation.
How to Use It
This layout serves to present survey results visually, making it suitable for data-driven presentations. It fits well after introductory slides that outline objectives or methodologies, providing a clear summary of findings. This structure is ideal for researchers, analysts, or marketers who need to convey survey data effectively. It can be used in contexts such as market research reports, academic presentations, or business strategy discussions, where data visualization enhances understanding.
Text Placeholders & Capacity
Keep your copy within these limits so it fits without resizing. Body slots can hold about 15-20 words each.
| Placeholder | Count | Max characters (approx.) |
|---|---|---|
| Slide title | 1 | 40 |
| Body paragraph | 4 | 100 |
| Item heading | 2 | 10 |
| Item body | 2 | 10 |
Slide Keywords
Download unlimited PowerPoint templates, charts and graphics for your presentations with our annual plan.
DOWNLOADReturn to Survey Presentation Template.