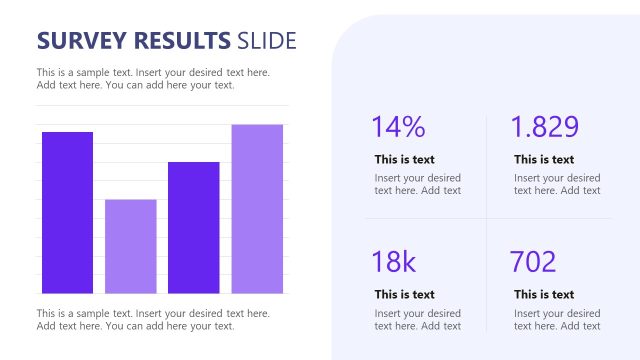
Slide 15 of 15 from Survey Presentation Template
Customizable Survey Presentation PPT Template
Survey Results Comparison Slide
- Chart
- Bar Horizontal
- Evaluation Slide
- 16:9
- 100% Editable
The Survey Results Comparison slide from the Survey Presentation Template offers a clear layout for comparing survey data across different years using side-by-side horizontal bar charts. This slide is designed for business presentations and pitch decks that require effective visualization of trends and forecasts. It includes editable shapes and vector icons to customize data categories, making it a practical choice for professionals preparing detailed survey results presentations.
What’s on This Slide
The slide displays two side-by-side bar charts labeled '2035' and '2050.' Each chart contains five horizontal bars representing different data categories, with varying shades of purple. The bars are aligned left within their respective containers, with numerical values on the horizontal axis ranging from 0 to 250. Below each chart, there are text placeholders for additional descriptions, centered and aligned to the bottom of the containers. The overall layout is clean, with a prominent title at the top, establishing a clear visual hierarchy.
How to Use It
This layout serves to compare survey results across two different timeframes, making it suitable for presentations on trends or forecasts. It fits well at the end of a presentation, summarizing key findings. This structure is ideal for researchers or analysts presenting survey data, as it allows for clear visual comparisons. It can also be used in marketing contexts to showcase projected changes in consumer behavior or preferences over time.
Text Placeholders & Capacity
Keep your copy within these limits so it fits without resizing. Body slots can accommodate roughly 15-20 words each.
| Placeholder | Count | Max characters (approx.) |
|---|---|---|
| Chart title | 1 | 30 |
| Item heading | 5 | 20 |
| Item body | 5 | 50 |
| Body paragraph | 2 | 100 |
Slide Keywords
Download unlimited PowerPoint templates, charts and graphics for your presentations with our annual plan.
DOWNLOADReturn to Survey Presentation Template.