Slide 6 of 15 from Survey Presentation Template
Customer Data Slide – Survey Presentation PPT Template
Survey Results Overview Slide
- Chart
- Other
- Evaluation Slide
- 16:9
- 100% Editable
The Survey Results Overview slide from the Survey Presentation Template provides a clear and structured way to present multiple survey statistics using editable shapes and vector icons. Designed for business presentation contexts, this slide layout supports effective data visualization and comparative analysis, making it suitable for pitch deck templates and corporate presentations that require concise performance metrics and survey analysis.
What’s on This Slide
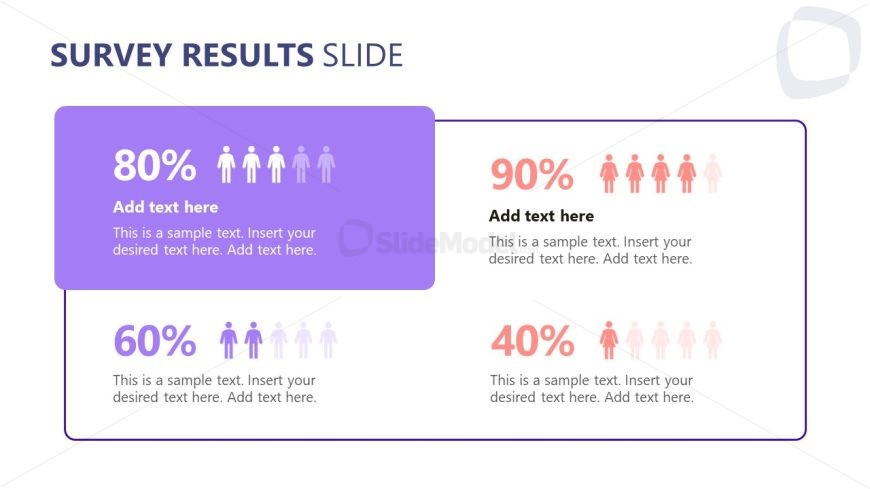
The slide features a structured layout with four sections, each containing a percentage value and corresponding icon representations. The top left section displays an 80% statistic in bold text, accompanied by a group icon. Adjacent to it, the top right section shows a 90% statistic with a similar design. Below, the left section presents a 60% statistic, while the right section indicates a 40% statistic. Each section includes a text placeholder for additional details, aligned beneath the percentage values. The background is predominantly white with a purple accent for the top left section, creating a visual hierarchy.
How to Use It
This layout serves as a comparative analysis of survey results, effectively displaying multiple statistics side by side. It is suitable for presentations that require a clear visual representation of data findings, particularly in business or research contexts. This slide fits well after introductory slides that outline survey objectives, making it ideal for summarizing key results. It can be used in various scenarios, such as marketing analysis, customer feedback presentations, or performance reviews.
Text Placeholders & Capacity
Keep your copy within these limits so it fits without resizing. Node body slots can hold roughly 15-20 words each.
| Placeholder | Count | Max characters (approx.) |
|---|---|---|
| Item heading | 4 | 10 |
| Item body | 4 | 100 |
Slide Keywords
Download unlimited PowerPoint templates, charts and graphics for your presentations with our annual plan.
DOWNLOADReturn to Survey Presentation Template.