Slide 4 of 13 from Strategic Overview PowerPoint Template
Current Performance Snippets – Slide with Charts
Current Performance Snapshots Slide
- Chart
- Dashboard Composite
- Evaluation Slide
- 16:9
- 100% Editable
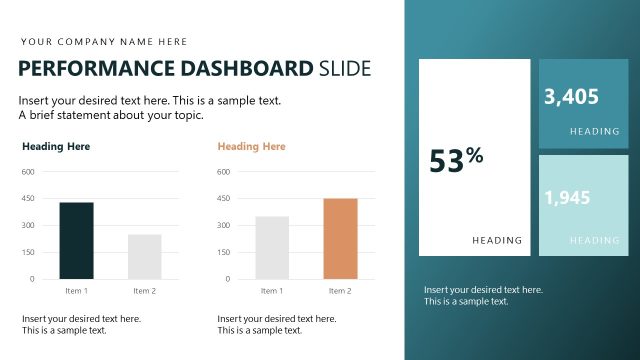
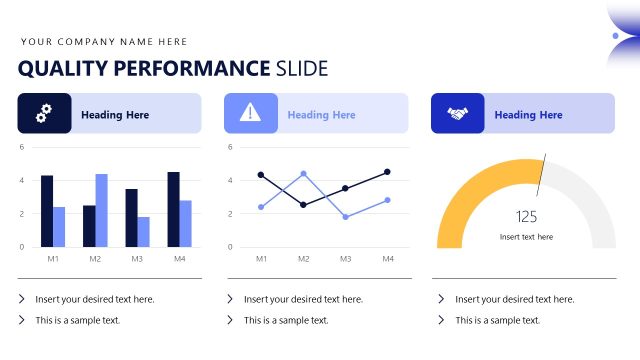
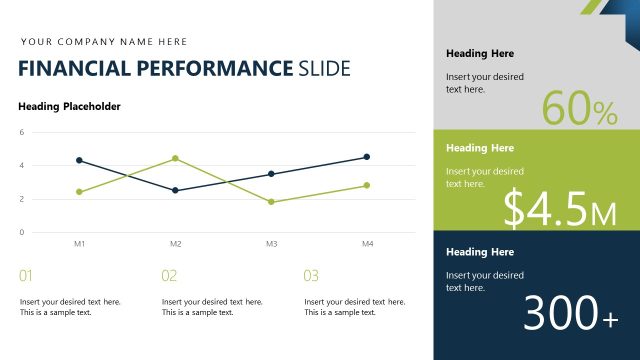
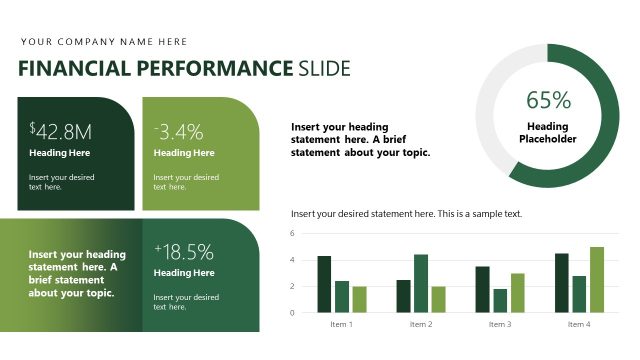
The Current Performance Snapshots slide from the Strategic Overview PowerPoint Template offers a clear evaluation layout combining bar charts and status tables. This design supports business presentations by providing an effective way to visualize quarterly performance metrics and project updates using editable slides and vector icons for clarity and impact.
What’s on This Slide
The layout features a left section with two bar charts stacked vertically, displaying performance metrics for four items. To the right, there is a table with three rows for measures, each containing colored status indicators (red, yellow, green) and trend arrows. The top of the slide includes a large title placeholder aligned to the left, while a secondary heading placeholder is positioned above the charts. Text placeholders are present for metrics and additional headings, with a circular graphic in the top right corner. The overall composition is balanced, with distinct sections for visual clarity.
How to Use It
This layout serves as a performance snapshot, ideal for presenting key metrics and trends in a business context. It fits well after problem framing slides, providing a clear overview of current performance. This structure is useful for quarterly business reviews, project updates, or strategic planning sessions where stakeholders need to assess performance at a glance. The combination of charts and tables allows for effective comparisons and highlights areas needing attention.
Text Placeholders & Capacity
Keep your copy within these limits so it fits without resizing. Body slots are tight, roughly 10 words each.
| Placeholder | Count | Max characters (approx.) |
|---|---|---|
| Slide title | 1 | 30 |
| Item body | 4 | 10 |
| Item heading | 4 | 10 |
| Body paragraph | 2 | 20 |
| Callout | 3 | 5 |
Slide Keywords
Download unlimited PowerPoint templates, charts and graphics for your presentations with our annual plan.
DOWNLOADReturn to Strategic Overview PowerPoint Template.