Slide 8 of 14 from Quarterly Management Review PowerPoint Template
Operational Performance Slide – Quarterly Management Review Template
Operational Performance Slide for Management Review
- Chart
- Dashboard Composite
- Evaluation Slide
- 16:9
- 100% Editable
The Operational Performance Slide from the Quarterly Management Review PowerPoint Template offers a structured layout ideal for presenting key operational metrics and KPI tracking. This slide template integrates editable shapes and vector icons to visualize data through bar charts, line graphs, and gauges, supporting data-driven decision making in business presentations and corporate slide decks.
What’s on This Slide
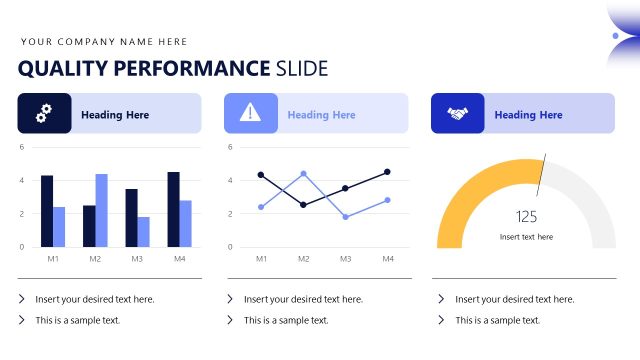
The layout features three distinct sections arranged vertically. The left section contains a bar chart with four columns representing data points labeled M1 to M4, along with a percentage value and an upward arrow. The center section displays a line graph with data points connected by lines, accompanied by a warning icon and a heading. The right section includes a circular gauge displaying a value of 125, with a handshake icon above it. Text placeholders are present for headings and additional information, aligned appropriately within each section.
How to Use It
This layout serves as a performance overview, suitable for presenting operational metrics in a management review context. It can effectively summarize key performance indicators, highlight trends, and showcase critical data points. This slide fits well in a sequence following an analysis of previous results, allowing for a clear transition into performance evaluation and future planning discussions. It is ideal for quarterly reviews, operational assessments, and performance tracking presentations.
Text Placeholders & Capacity
Keep your copy within these limits so it fits without resizing. Body slots are tight, roughly 5-10 words each.
| Placeholder | Count | Max characters (approx.) |
|---|---|---|
| Slide title | 1 | 30 |
| Item body | 4 | 20 |
| Item heading | 4 | 15 |
| Chart title | 1 | 25 |
| Kpi value | 1 | 5 |
Slide Keywords
Download unlimited PowerPoint templates, charts and graphics for your presentations with our annual plan.
DOWNLOAD