Slide 6 of 13 from Management Report PowerPoint Template
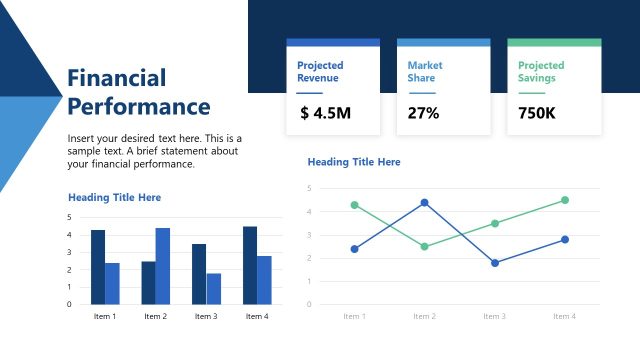
Double Line Chart for Financial Performance Overview
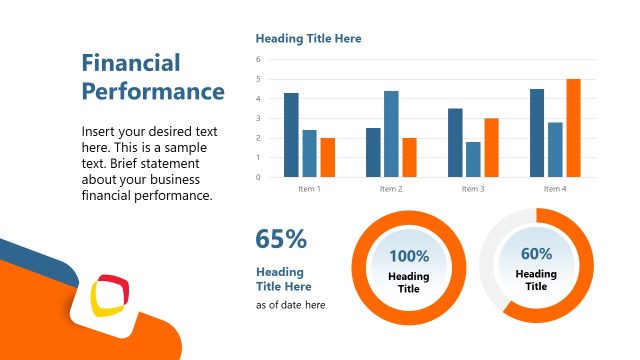
Financial Performance Slide for Management Report
- Chart
- Line Chart
- Financial Summary Slide
- 16:9
- 100% Editable
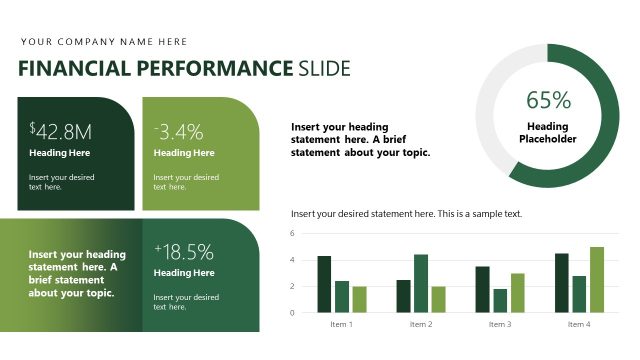
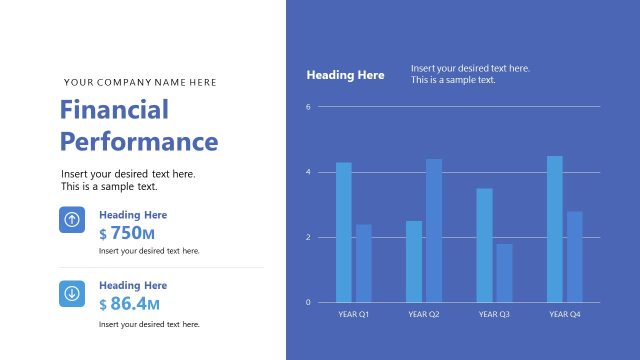
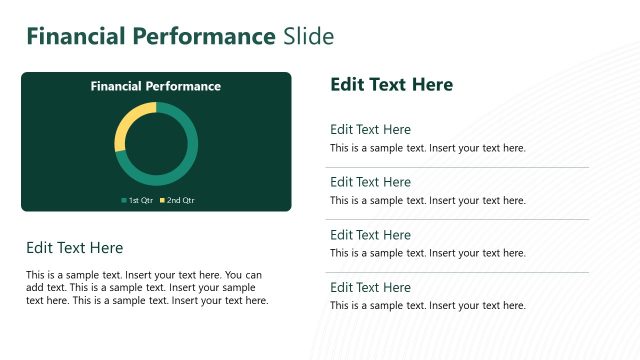
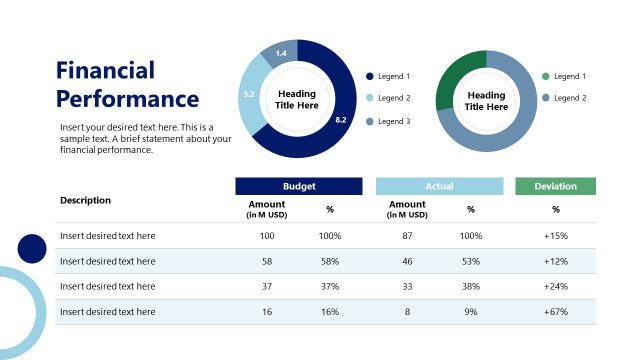
The Financial Performance Slide from the Management Report PowerPoint Template offers a clear layout for presenting financial data with a central line chart and distinct text sections. This slide template is well-suited for business presentations such as quarterly reviews and KPI reporting, combining editable shapes and vector icons to enhance data visualization. It supports effective communication of financial trends and key metrics within a corporate presentation or pitch deck template.
What’s on This Slide
The layout features a line chart positioned centrally, displaying data points for four months labeled M1 to M4. Above the chart, there is a prominent title placeholder for the company name and slide title, aligned left. On the right side, three vertical sections contain placeholders for headings and text, with the first section showing a percentage, the second displaying a monetary value, and the third indicating a numerical figure. Each section has a distinct background color, creating visual separation. The overall composition balances the chart with textual elements, emphasizing data visualization.
How to Use It
This layout serves to present financial performance metrics, ideal for reporting trends over time. It fits well in a sequence following an overview or KPI slide, providing detailed insights into financial data. Suitable for business contexts such as quarterly reviews, budget assessments, or financial forecasts, it allows for clear communication of key performance indicators. The right-side text sections can highlight significant figures or summaries, enhancing audience understanding of financial health.
Text Placeholders & Capacity
Keep your copy within these limits so it fits without resizing. Text slots are tight, roughly 10-15 words each.
| Placeholder | Count | Max characters (approx.) |
|---|---|---|
| Slide title | 1 | 30 |
| Item heading | 4 | 10 |
| Item body | 4 | 50 |
| Kpi value | 3 | 10 |
Slide Keywords
Download unlimited PowerPoint templates, charts and graphics for your presentations with our annual plan.
DOWNLOADReturn to Management Report PowerPoint Template.