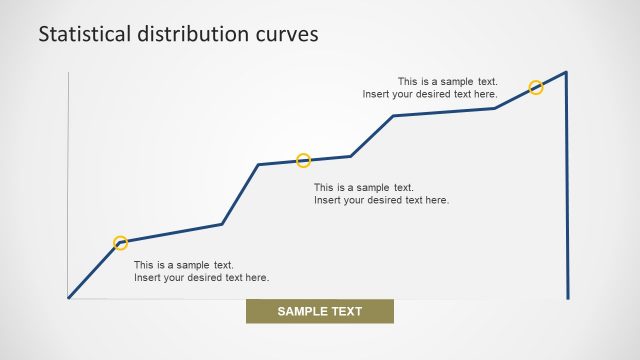
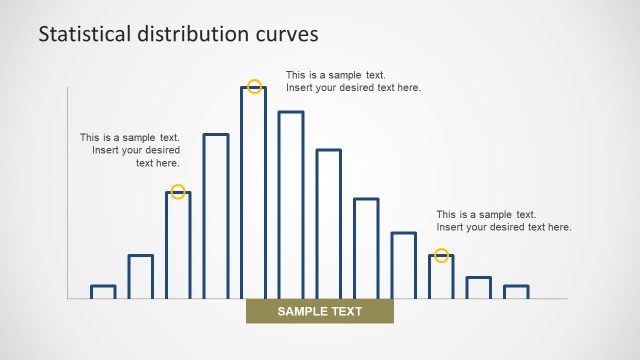
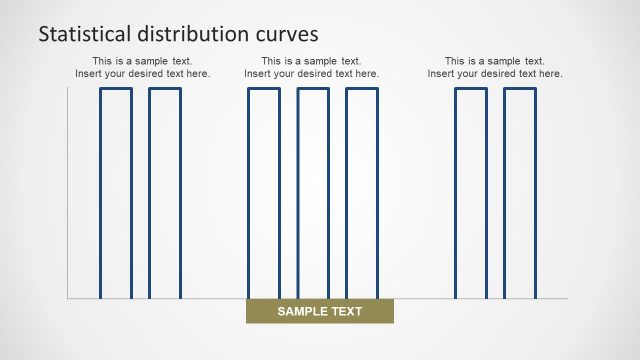
Negative Value Run Chart
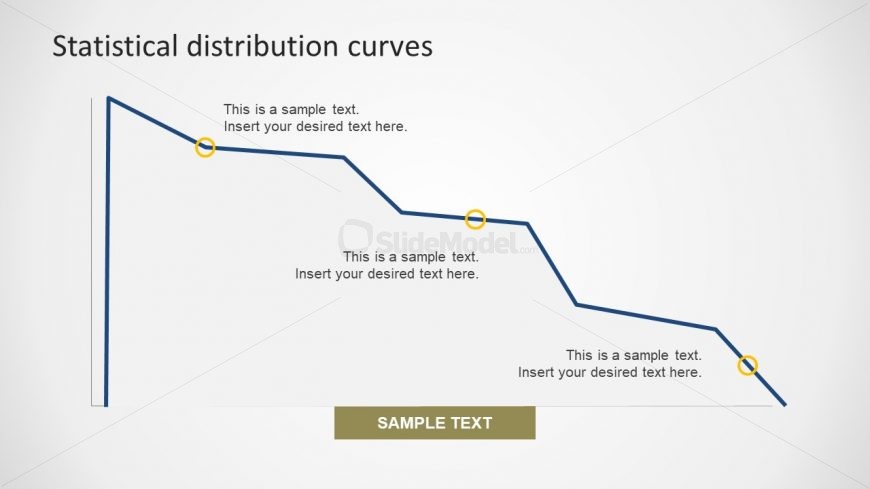
The Negative Value Run Chart template slide is a line graph of data which shows a progressive growth. The data is usually collected over time through the trends or patterns of the process. The template shows the run chart for unstable process and how they run. This run chart is also known as run-sequence plot which displays the data in time sequence. This slide is useful is analysis of business activities, economic data and more in line chart. The incredible statistical distribution template has the growth line with is editable. Therefore, users can modify the ups and downs in the progress line.
Return to Statistical Distribution PowerPoint Curves.