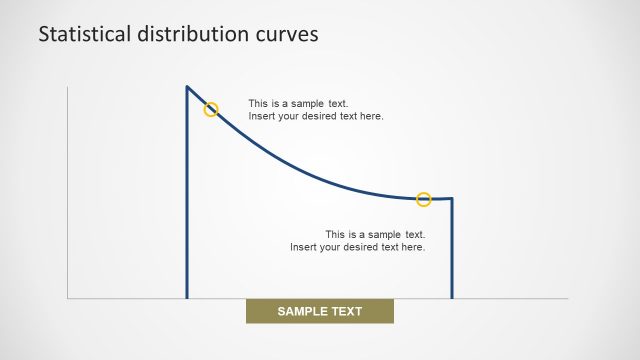
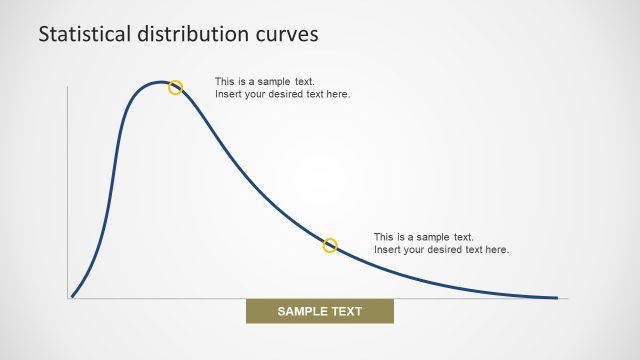
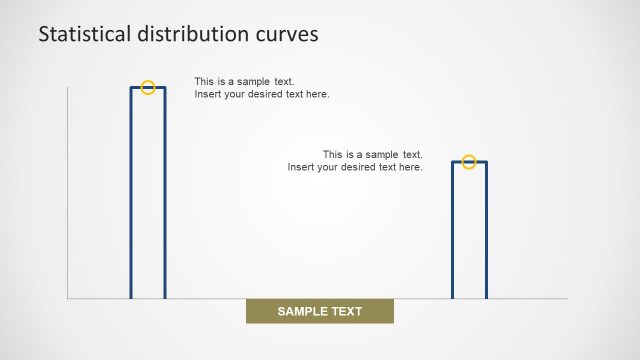
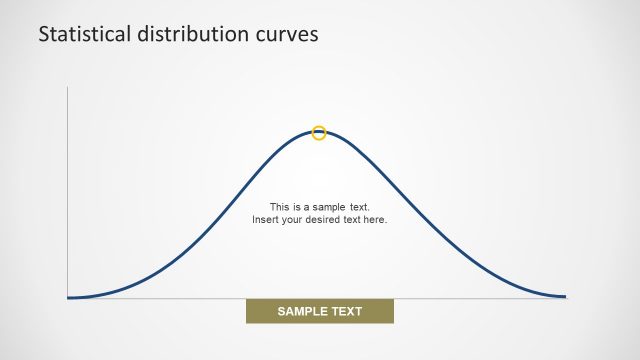
Positive Progress Run Chart
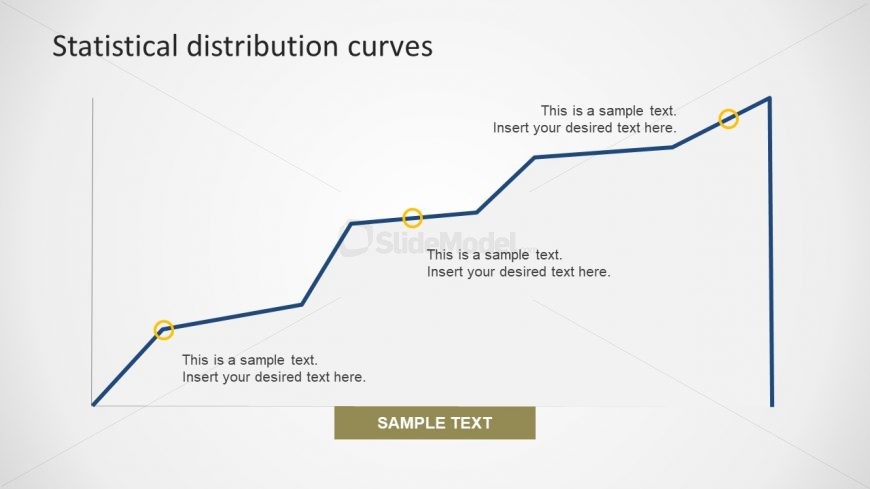
The slide of Positive Progress Run Chart is an incredible tool to present growth for different concepts. This graph is also useful to display trend analysis, process monitoring. It also helps shifting the process activities. This graph is the deviation of scale parameters which can affect the quality of specific processes. These charts are famous tool to display the change cause by any assignable cause. This slides present monitoring to ensure the project is in control. The users can update this diagram by changing the size and rotation of progress line.
Return to Statistical Distribution PowerPoint Curves.