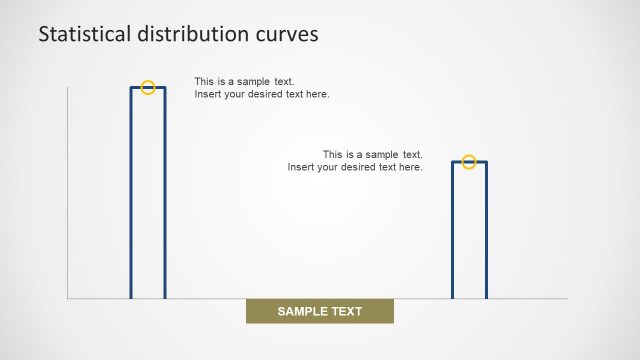
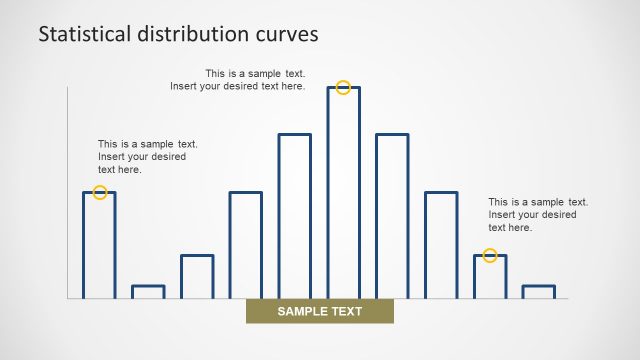
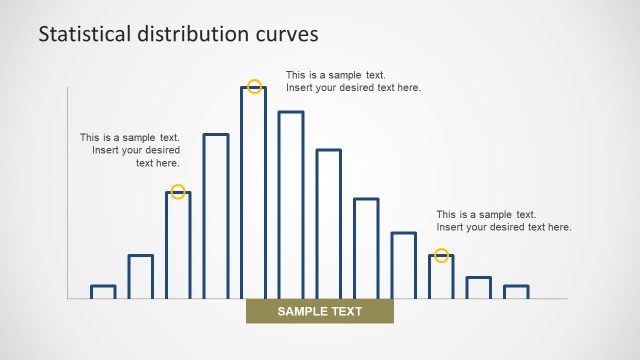
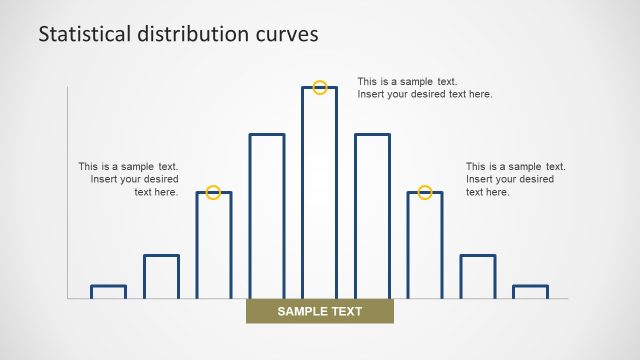
Multiple Variable and Value Distribution
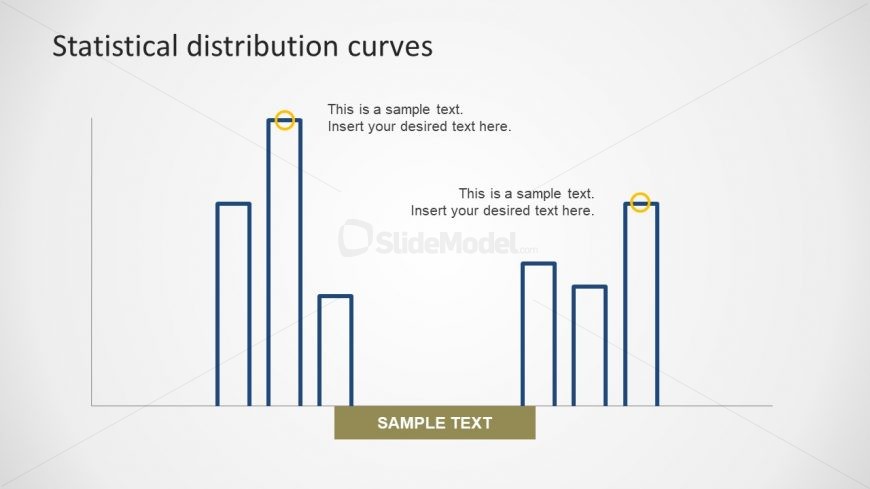
The bimodal slide of Multiple Variable and Value Distribution is a professional template design of bar chart. This graph shows two peaks of data vales in the range which appear more frequently. The data appears in the bell shape curve of normal distribution. This slide can benefit the professional of business and management analysis. For instance, display the pattern of multiple occurrences of one group of data. This PowerPoint template is an editable presentation with various customizations. Also, this statistical distribution slide has bar shape which can be deleted or copied to make more bars.
Return to Statistical Distribution PowerPoint Curves.